How to display Connection server metrics with graphic charts in ThingWorx
- Connection server + InfluxDB + Grafana work together can display connection server metrics in graphic charts
- Download and set up connection server
- Download InfluxDB and configure InfluxDB
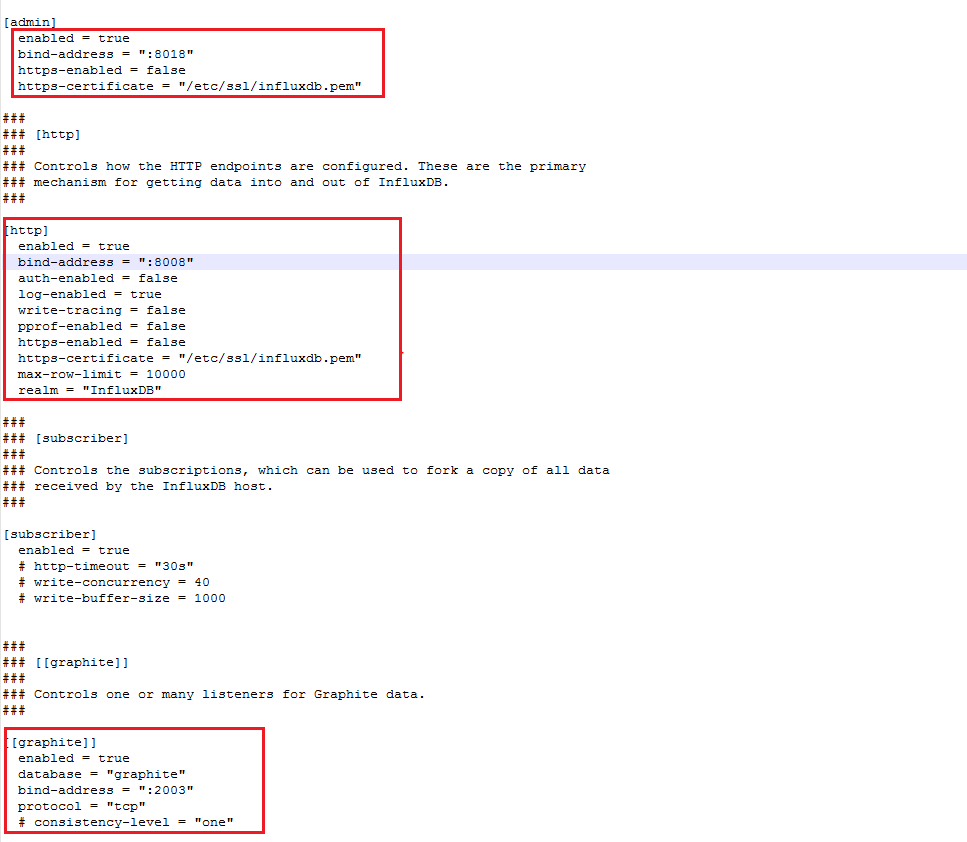
- edit <influxdb home>\influxdb.conf file
- Note: [admin] is InfluxDB admin login page, [http] is Grafana connected settings, [graphite] is connection server connected settings
- Run influxd.exe file with below commands (windows cmd)
- <path>/influxd -config <path>/influxdb.conf
- Run influx.exe file with below commands (in my case the port is 8008)
- <path>/influx -port 8008
- Start connection server
- Login to InfluxDB by using URL http://localhost:8018. Choose Database graphite and Query SHOW MEASUREMENTS
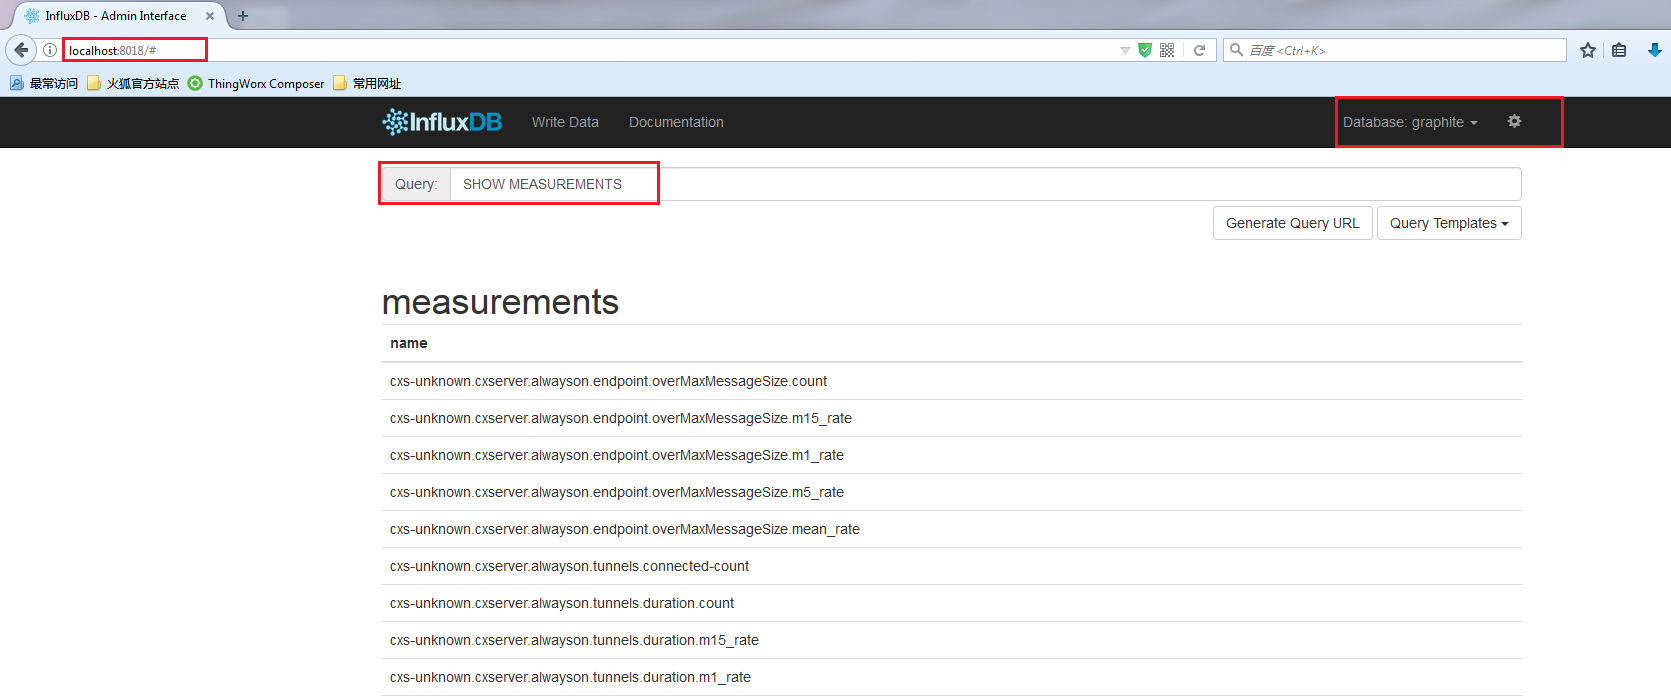
- Note: There should be many connection server metrics
- Double click grafana-server.exe file (<path>/grafana-4.2.0.windows-x64/grafana-4.2.0/bin)
- Login to Grafana with URL http://localhost:3000
- The default login username and password is admin/admin
- Create a new Data Source
- Note: Type, Url and Database properties are required.
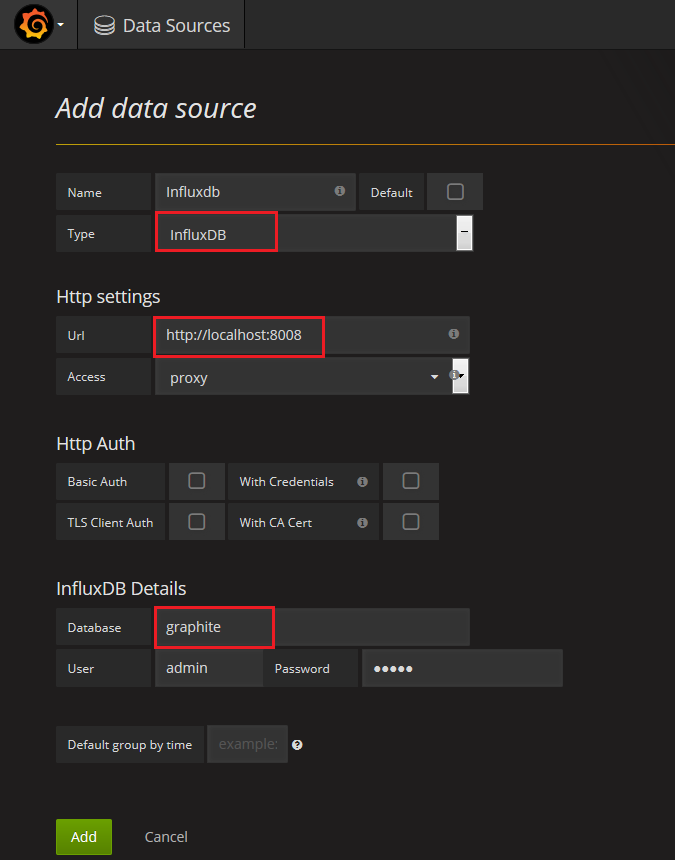
- Save & Test. If the connection is set up successfully, there should be a green message pop-up.
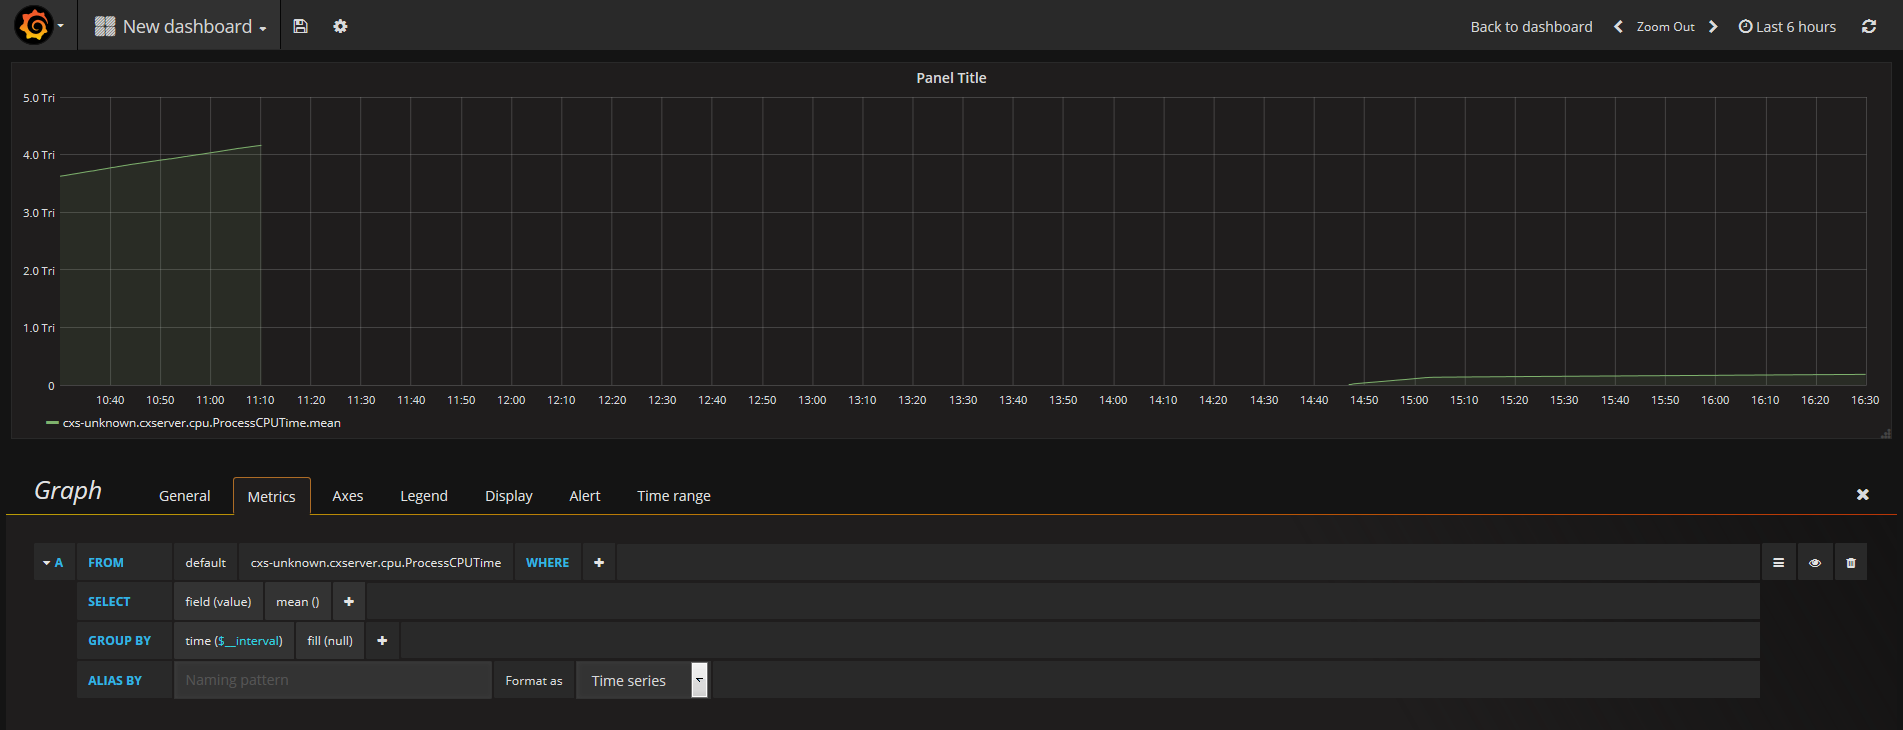
- Create a new dashboard
- Add a new Row, and set up its metrics by create new querys
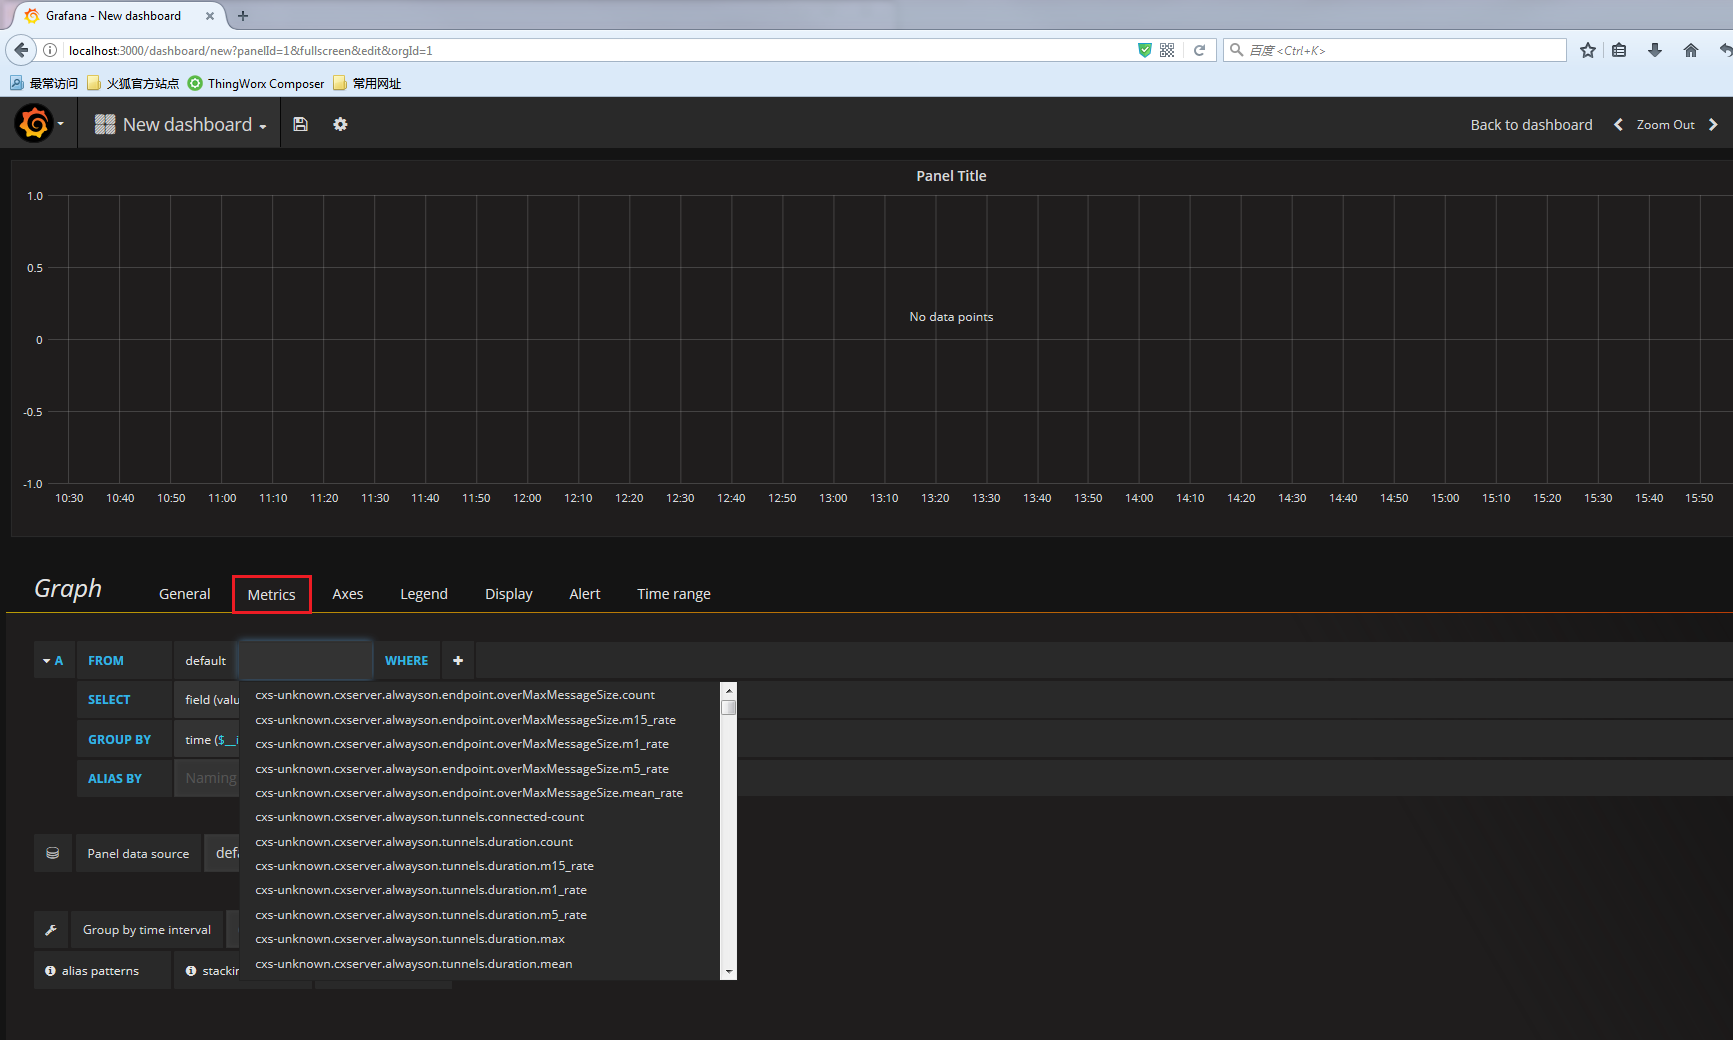
- Sample result:
- edit <influxdb home>\influxdb.conf file