

Track Issues with Pareto Chart Part 1
- November 1, 2022
- 0 replies
- 473 views
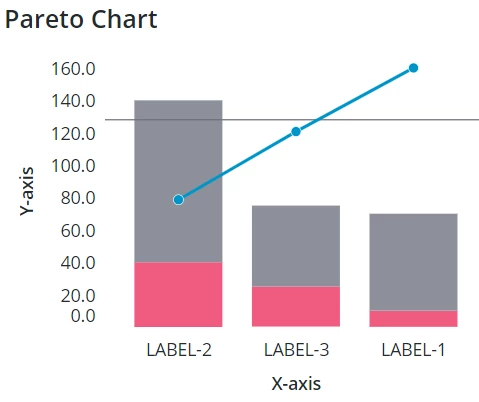
Use the Pareto Chart Widget to visualize how issues compound to cause problems.
GUIDE CONCEPT
The Pareto Chart Widget is a useful method of displaying aggregate information.
In particular, it is often used to display multiple issues and how they combine to form an overall, larger problem.
This can be helpful when trying to determine "easy wins" by pointing out where your efforts will have the greatest impact.
YOU'LL LEARN HOW TO
- Create a Data Shape
- Create a Thing
- Create an Info Table Property
- Populate an Info Table with appropriate data for a Pareto Chart
- Create a Mashup
- Utilize a Pareto Chart to display issue-aggregation
NOTE: This guide's content aligns with ThingWorx 9.3. The estimated time to complete this guide is 30 minutes
Step 1: Scenario
In this guide, we'll assume a scenario where a factory is being automated using ThingWorx Foundation. In particular, this factory has some known issues with a robot arm that performs welding at a point along a conveyor belt.
When this welding robot has these issues, the factory line has to come to a complete halt while maintenance is performed on it.
Management has decided that these slow-downs are costing enough money that the robot arm needs some extra attention, up to and including modification to help alleviate these maintenance stops.
However, they're not sure what to tackle first. Every issues leads to a slow down, but some happen more frequently than others.
After talking with maintenance, four primary issues are identified, i.e.
- Excess temperature on the welding end has caused some welds to fail due to simply burning through the material.
- Some of the joints need regular lubrication, preventing the arm from getting to the correct location in time as the part moves down the conveyor belt.
- The welding filler-material sometimes runs out, causing a stop while more is reloaded.
- The welding shielding gas sometimes runs out, causing a stop while more is reloaded.
Your task, then, is to start counting the number of times each of these failures occur. In addition, you need to create a small GUI which displays both how often these errors occur, and how they contribute to the overall downtime.
To accomplish this, you'll use a Pareto Chart Widget.
Step 2: Create Data Shape
In this scenario, we'll store the Pareto Chart's data in a Property type called an Info Table.
An Info Table is a spreadsheet-like Property, but in order to define the columns of the table, we first have to define a Data Shape. We'll do that in this step.
- In the left-side navigation, click Browse > Modeling > Data Shapes.
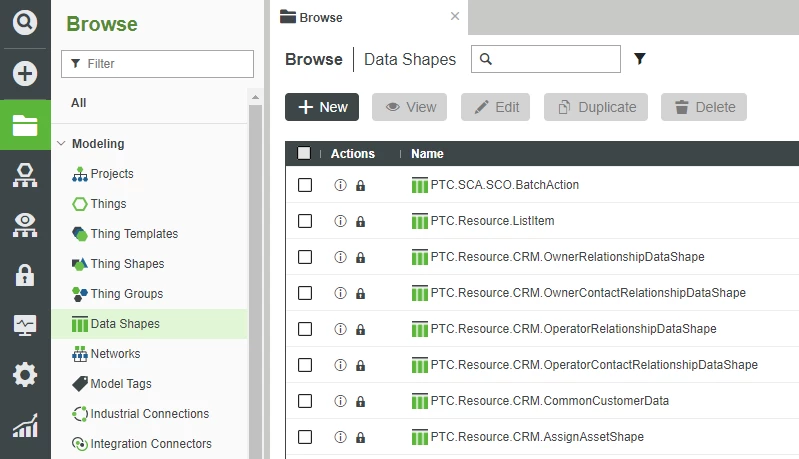
- At the top, click + New.
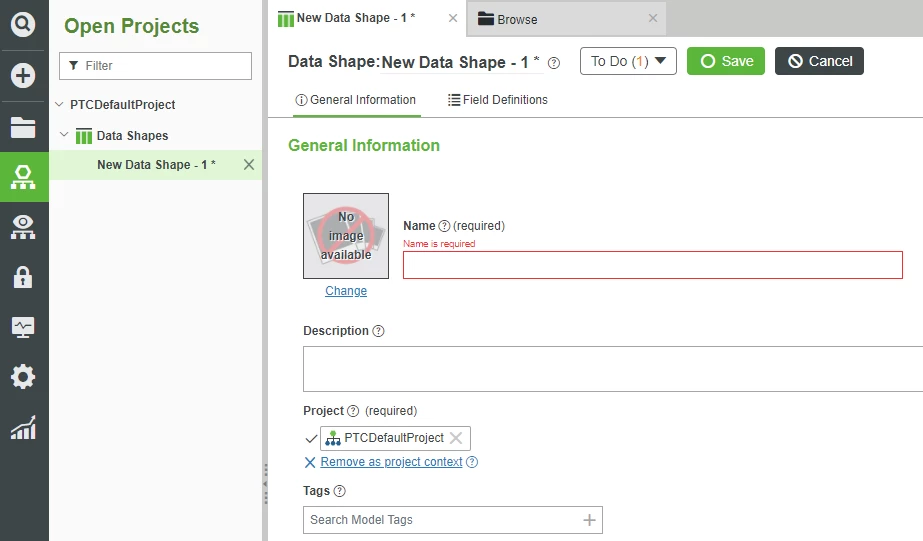
- In the Name field, type TIPC_DataShape.
- If Project is not already set, search for and select PTCDefaultProject.
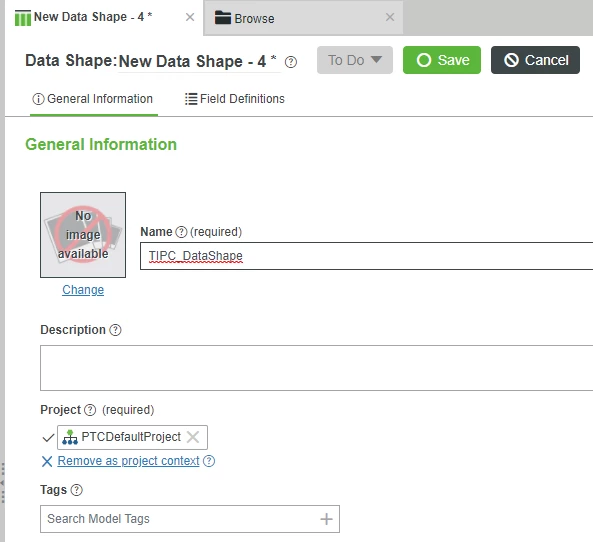
- At the top, click Field Definitions.
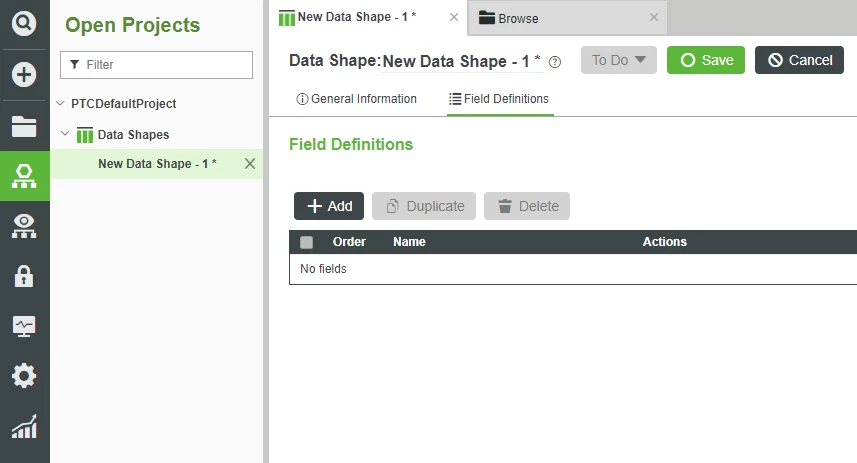
- At the top-left, click + Add.
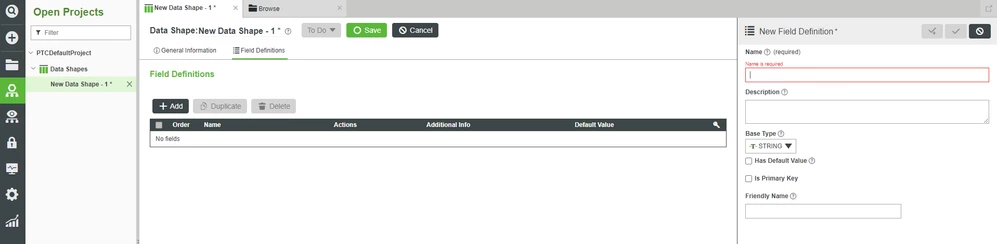
- On the right-side slide-out, in the Name field, type month.
- Note that you want to leave "Base Type" as the default of "STRING".
- Note that you want to leave "Base Type" as the default of "STRING".
- Check Is Primary Key.
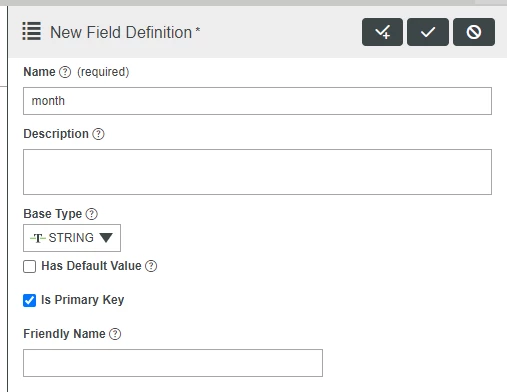
- Click the "check with a plus" button for Done and Add.
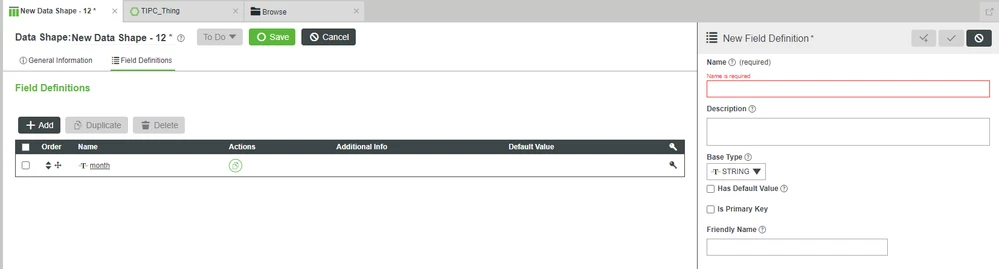
- Add each of the following Field Definitions, entering the Name and selecting the Base Type from the drop-down as described in the table:
- Note that you will NOT enable "Is Primary Key" on any other Field Definitions, as you only need one Primary Key.
- Note that you will simply click the "check" button for Done after the last entry
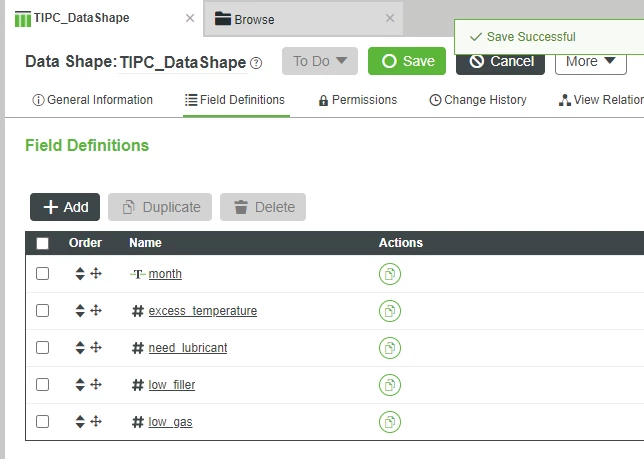
.Name Base Type excess_temperature NUMBER need_lubricant NUMBER low_filler NUMBER low_gas NUMBER 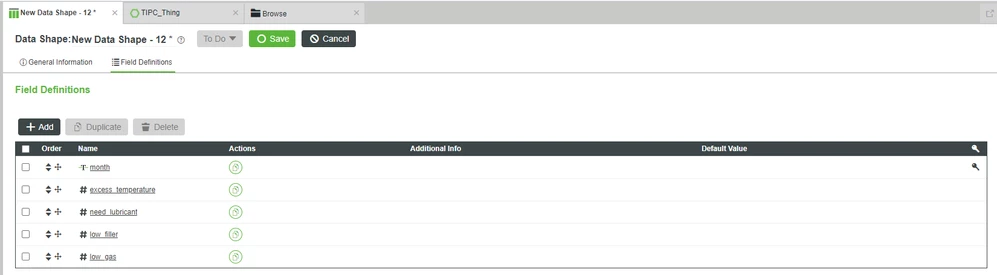
- At the top, click Save.
Step 3: Create Thing
Now that we have our Data Shape, we can create a Thing to hold the collected counts of various issues.
As already mentioned, we'll use an Info Table Property, formatted by the previously-created Data Shape, to do so.
- Click Browse > Modeling > Things.
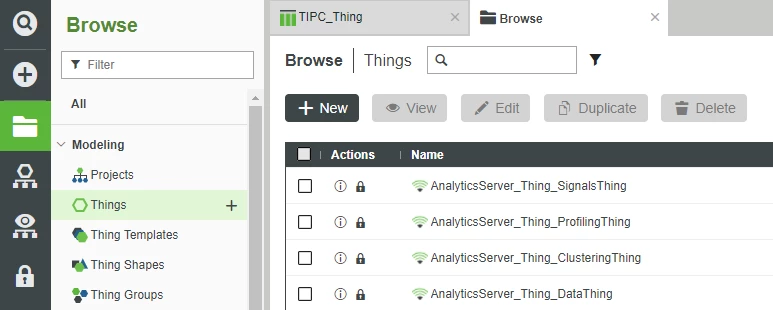
- Click + New.
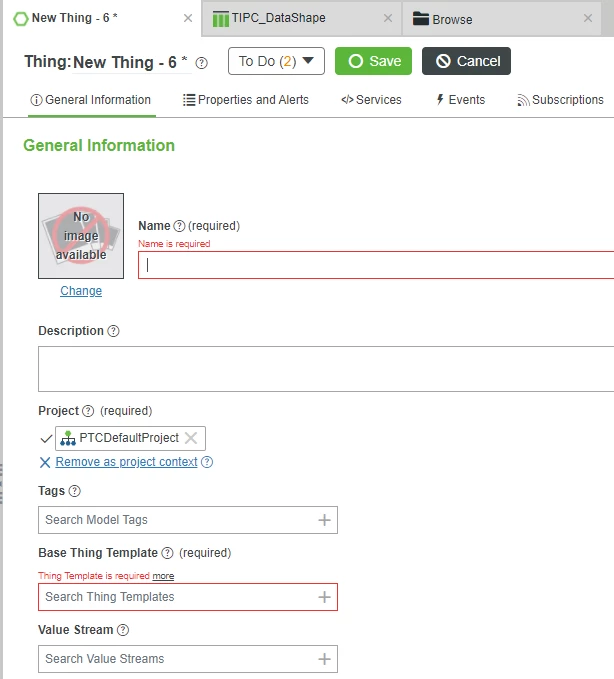
- In the Name field, type TIPC_Thing.
- If Project is not already set, search for and select PTCDefaultProject.
- In the Base Thing Template field, search for and select GenericThing.
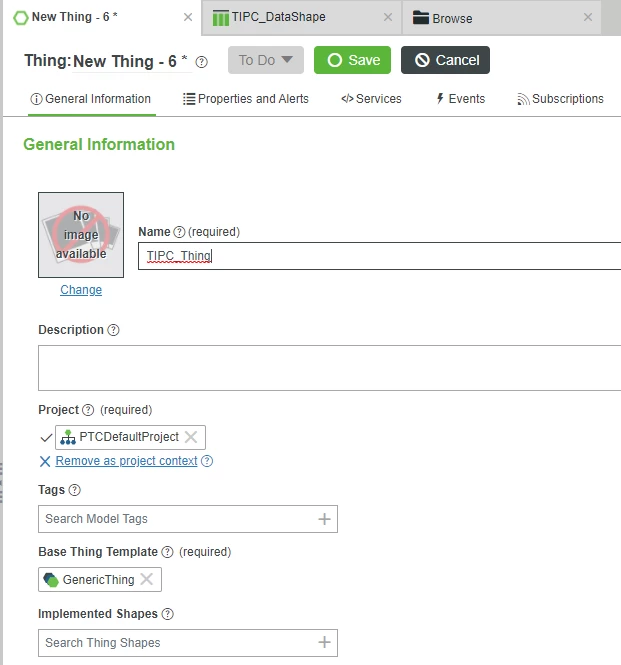
- At the top, click Save.
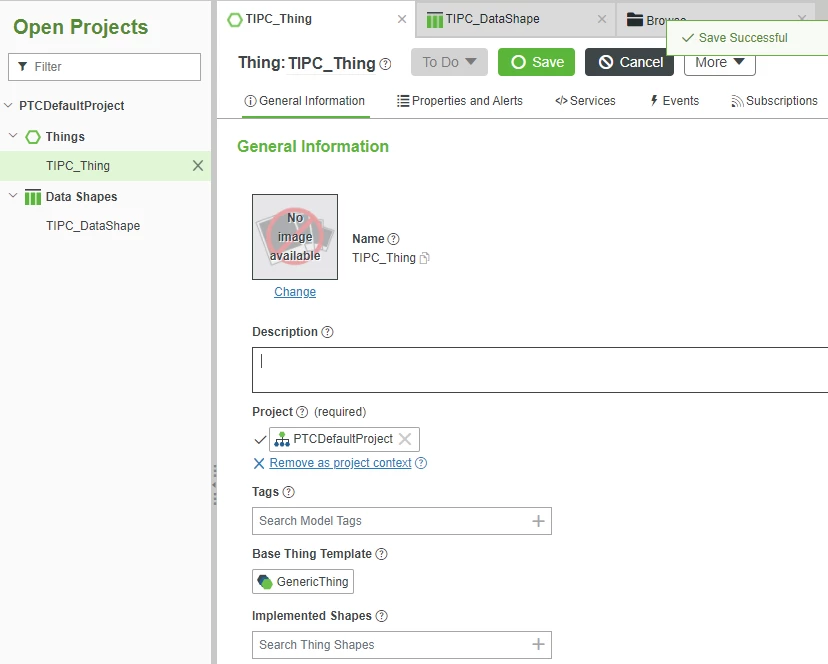
Add Info Table Property
Now that we have our Thing instantiated, we want to both add an Info Table Property, as well as set some Default Values.
- At the top, click Properties and Alerts.
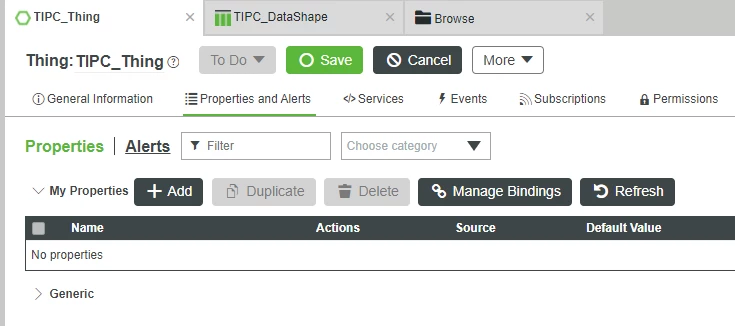
- Click + Add.
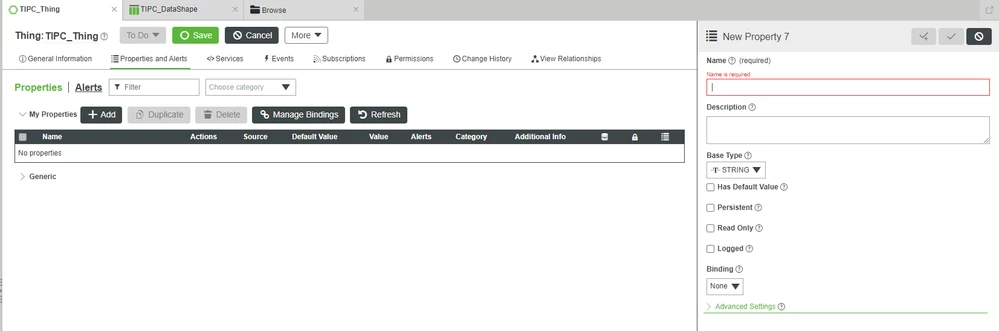
- On the right-side slide-out, in the Name field, type InfoTable_Property.
- Change Base Type to INFOTABLE.
- In the Data Shape field, search for and select TIPC_DataShape.
- Note that the Data Shape field will not appear until you set Base Type to INFOTABLE.
- Note that the Data Shape field will not appear until you set Base Type to INFOTABLE.
- Check Persistent.
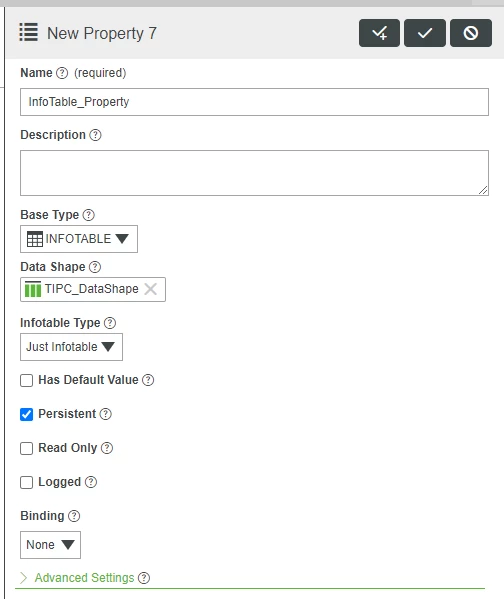
- At the top-right, click the "check" button for Done.
- At the top, click Save.
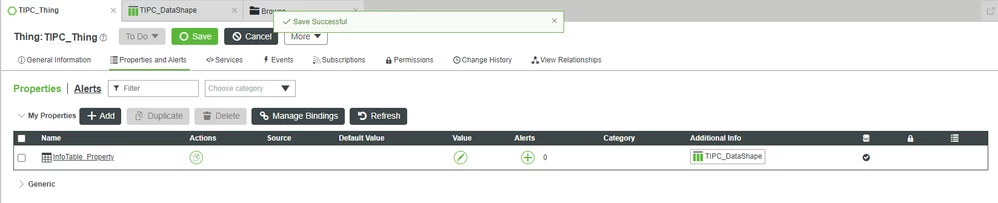
Set Value of Property
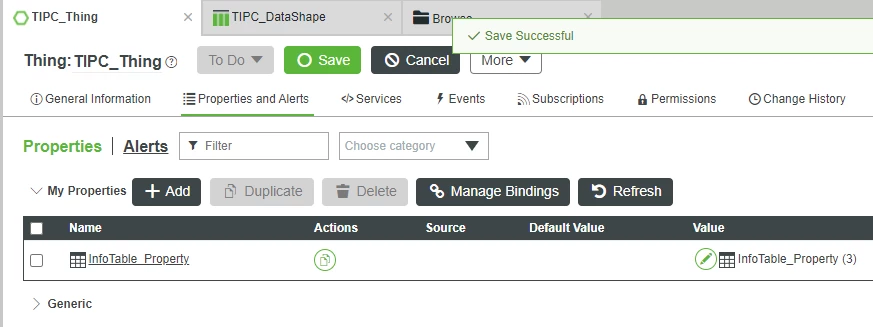
Now that we have a place in which to store spreadsheet-like values, we'll do so manually for testing.
- On the InfoTable_Property row, under the Value column, click the "pencil" icon for Set value of property.
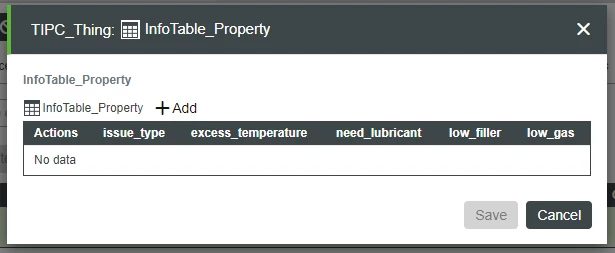
- On the pop-up, click + Add.
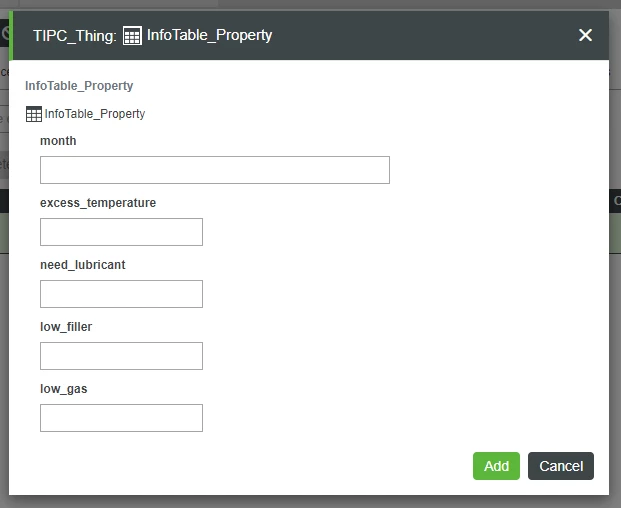
- Enter the following values in each field as per the table below:
Field Name Value month January excess_temperature 5 need_lubricant 2 low_filler 1 low_gas 2 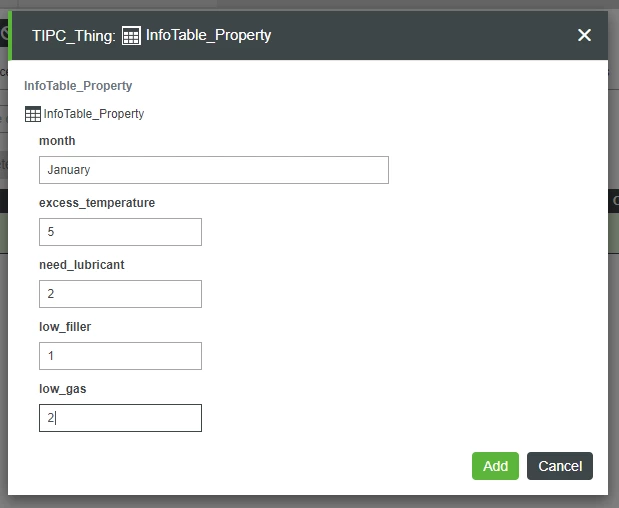
- Click Add.
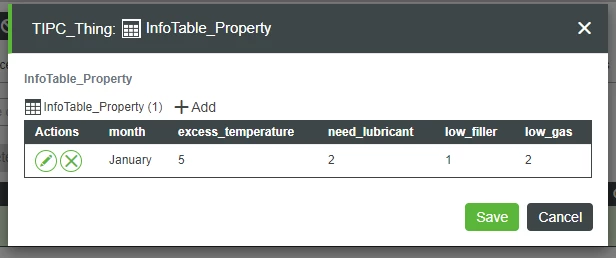
- Click + Add again, enter the following values, and finish input by clicking Add, as per above.
Field Name Value month February excess_temperature 7 need_lubricant 1 low_filler 3 low_gas 2
6. Click + Add again, enter the following values, and finish input by clicking Add, as per above.
| Field Name | Value |
| month | March |
| excess_temperature | 6 |
| need_lubricant | 2 |
| low_filler | 1 |
| low_gas | 1 |
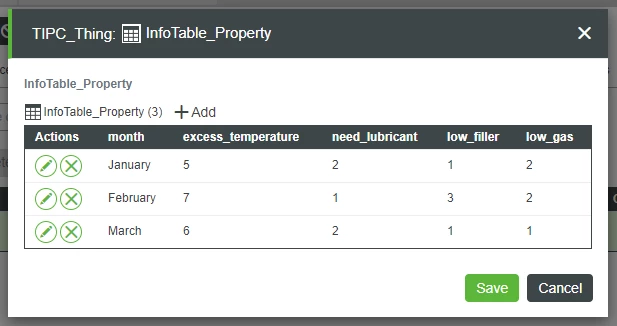
7. On the pop-up, click Save.
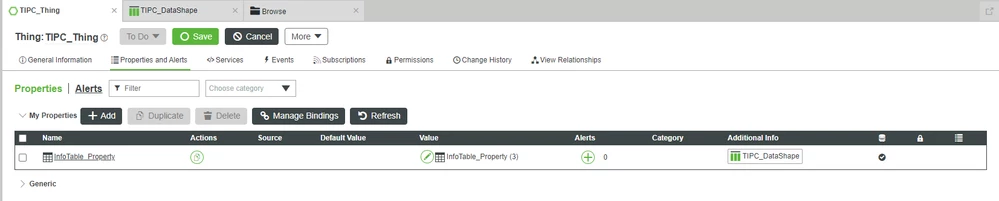
8. At the top, click Save.
Step 4: Create Mashup
Now that we have our data in-place for testing (and could be connected to automated systems after we finish testing), we need to visualize the data.
As mentioned, we'll use a Pareto Chart Widget, but first, we need to create a Mashup into which we can place the Widget.
- Click Browse > Visualization > Mashups.
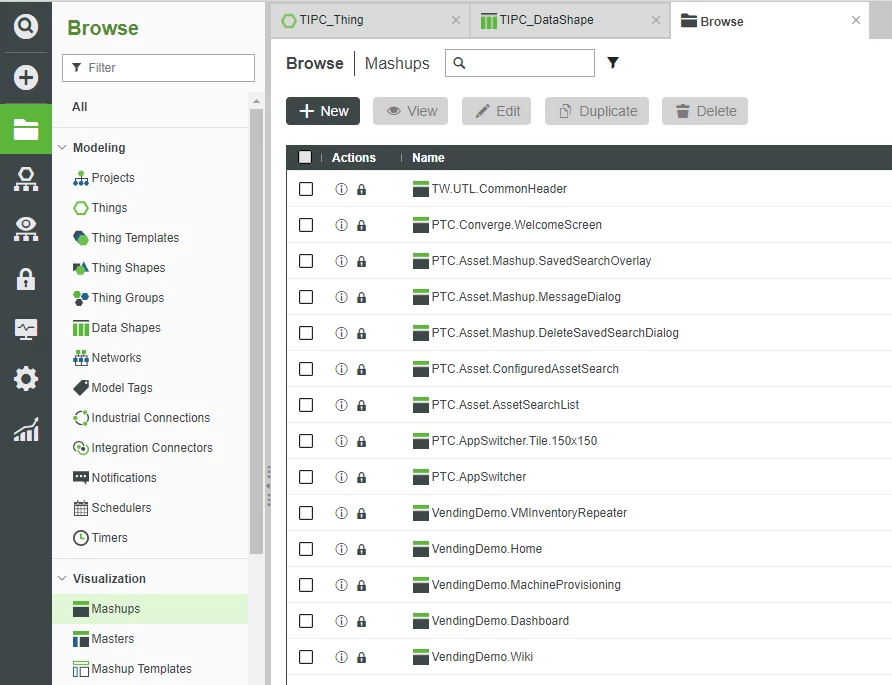
- Click + New.
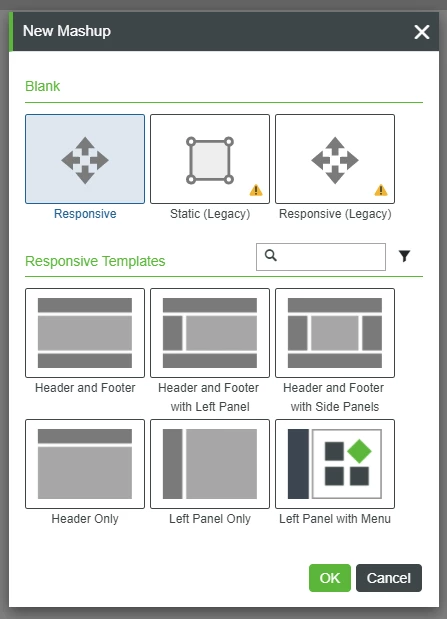
- Leave the defaults and click OK.
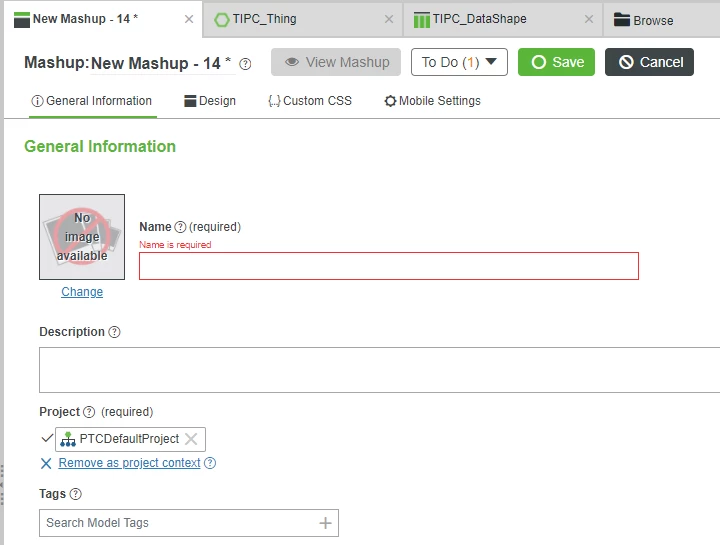
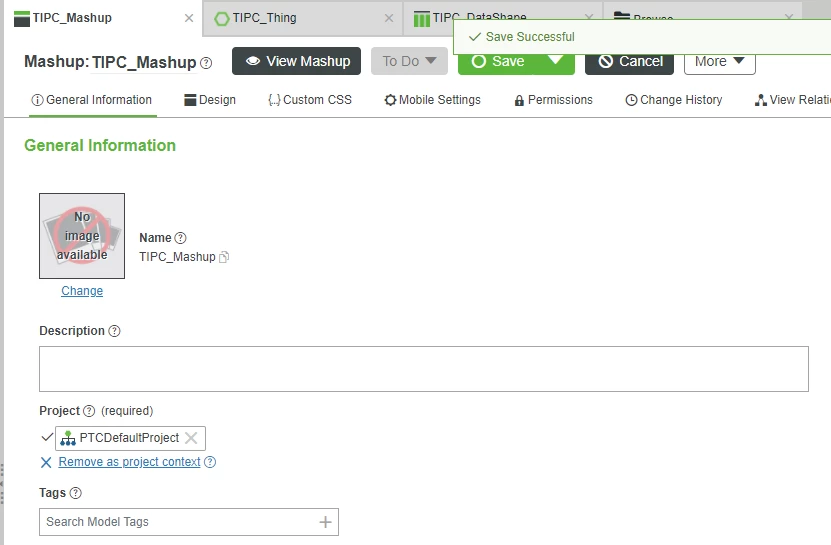
- In the Name field, type TIPC_Mashup.
- If Project is not already set, search for and select PTCDefaultProject.
- At the top, click Save
.
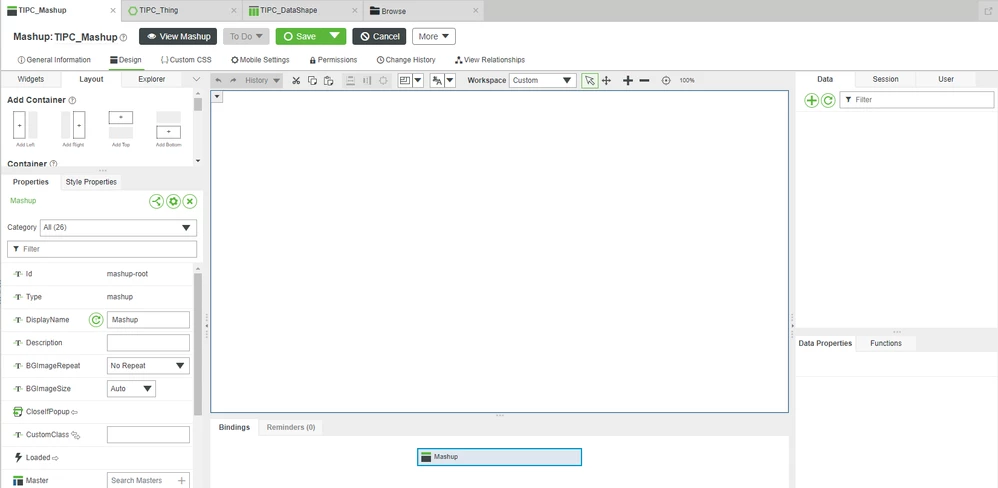
- At the top, click Design.
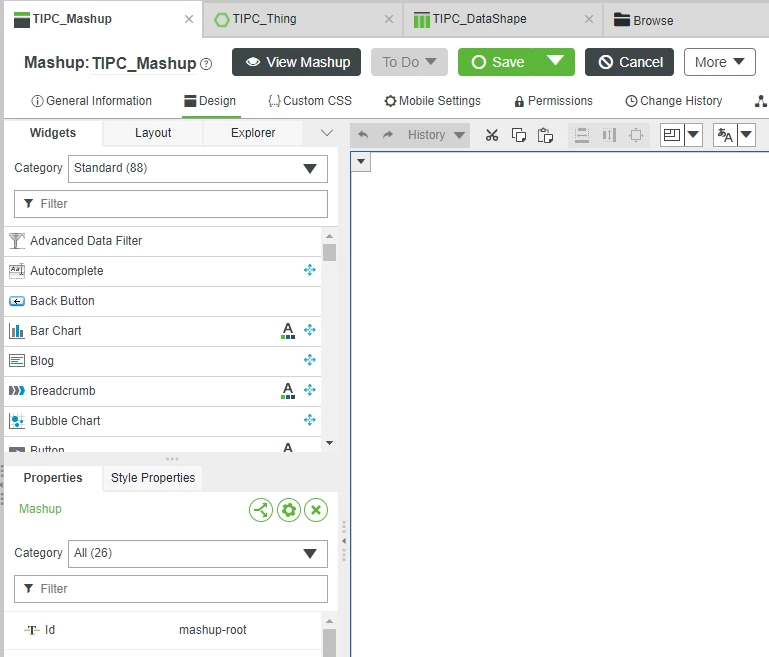
- At the top-left, click the Widgets tab.
- Drag-and-drop a Pareto Chart Widget onto the central Canvas.
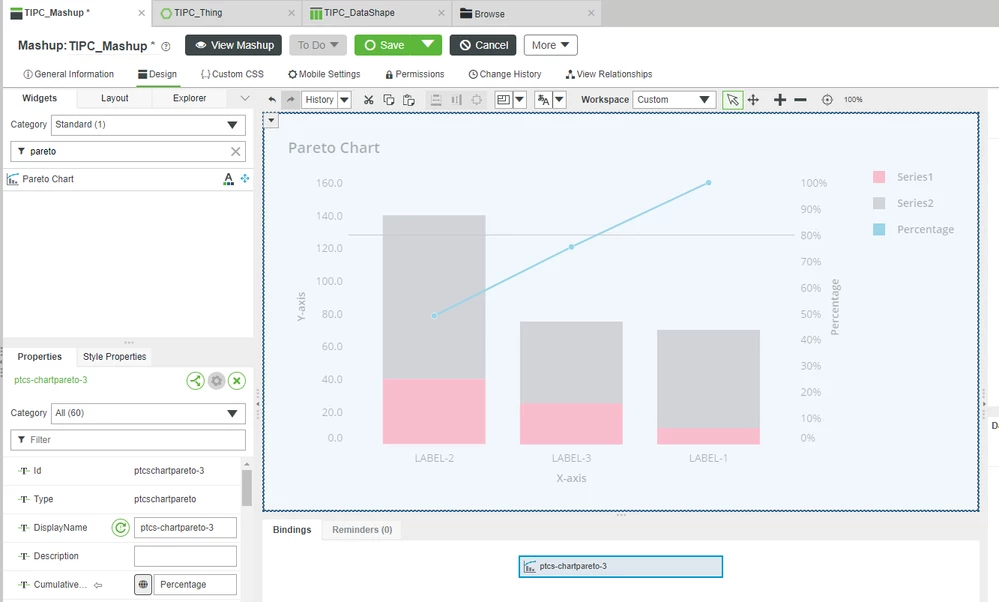
- At the top, click Save.
Click here to view Part 2 of this guide.