1-Visitor
July 23, 2014
Question

2-D plot resolution

  • July 23, 2014
  • 2 replies
  • 6452 views

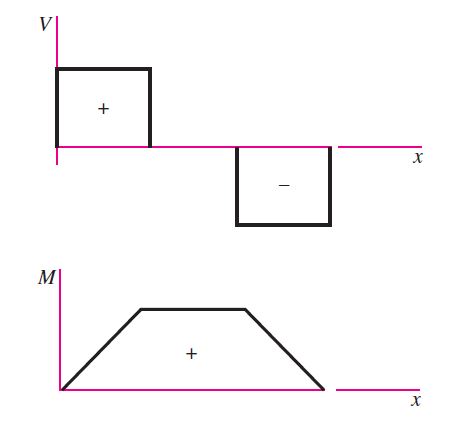
I made a shear and moment diagram plot in mathcad and it should look like this:

shear.JPG

However, in mathcad, mine is looking like this:

shear.JPG

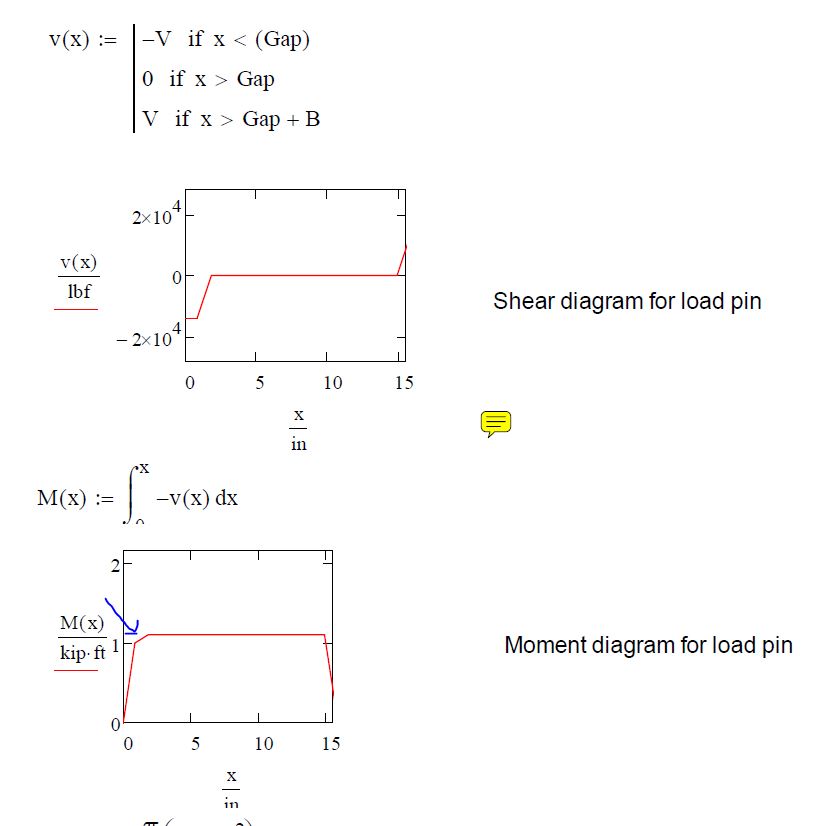
The problem, in particular is that on the moment diagram at about x= 1" there's a "knee" in the moment diagram that shouldn't be there.

Does anyone know the cause of the "knee?" Anyway to increase the resoltion of the plot?

2 replies

1-Visitor
July 23, 2014

What happens when x = gap? The definition of v is the issue.

Please upload a worksheet.

1-Visitor
July 23, 2014
19-Tanzanite
July 23, 2014

You don't show how x is defined, but looking at the graph I'll guess it's a range variable 0*in,1*in..15*in. So you get a point every 1 inch. Make the increment much smaller, say 0*in,0.01*in..15*in.

If that's not the problem, please post a worksheet.

1-Visitor
July 23, 2014

How exactly would you decrease the increment?

1-Visitor
July 23, 2014