1-Visitor
February 17, 2017
Solved

3D graphs

  • February 17, 2017
  • 3 replies
  • 2728 views

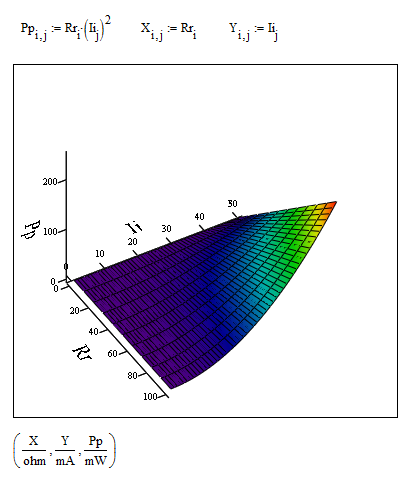
I have 2D matrix (NxM) created with indices which I like to plot in 3D. I wish to change the axes to display not the indices but rather the actual vector that have generated them (with units).

Please see the attachment.

How can I do that?

Best answer by RichardJ

3 replies

21-Topaz II
February 17, 2017

Hi Federico,

Click twice quickly on the chart, so as to show the control panel as shown below. With it you can make any changes you want.

plot 00.jpg

fpettazzi1-VisitorAuthor
1-Visitor
February 20, 2017

Hello F.M.

Thanks for the answer....I was looking more to what has been posted below from Richard & Werner.

Best

F

RichardJ19-TanzaniteAnswer
19-Tanzanite
February 17, 2017
fpettazzi1-VisitorAuthor
1-Visitor
February 20, 2017

Thanks! This is what I was looking for.

Cheers

Federico

25-Diamond I
February 17, 2017

Here is a solution which just uses a function P(R,I) and CreateMesh, but the drawback is, that is has to be used unit-less and to show the results in other than the base units, you have to modify the function, which may be misleading. So you might prefer Richards solution.

fpettazzi1-VisitorAuthor
1-Visitor
February 20, 2017

Dear Werner,

Thanks a lot. I indeed find the solution of Richard more practical, but I am not familiar with CreateMesh and I will use your file to get to know this function.

best

Federico