1-Visitor
September 17, 2013
Question

3D plot problems

  • September 17, 2013
  • 2 replies
  • 2903 views

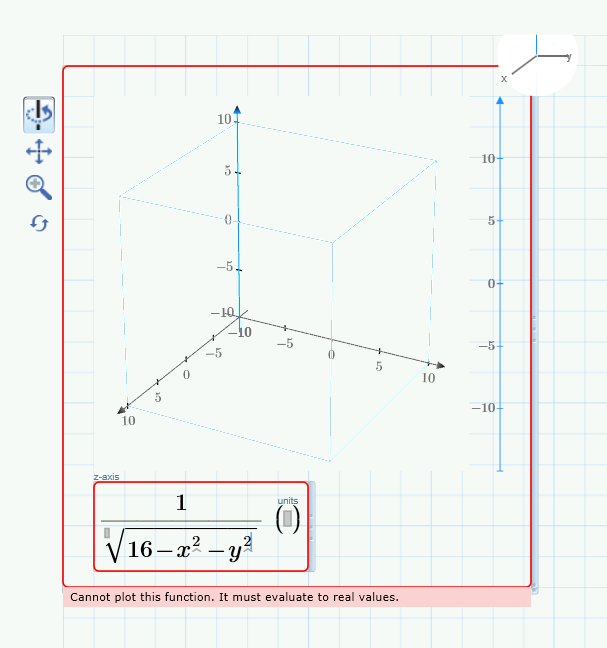
Im trying to plot in the function below to see the level curves, but it won't work.
I don't understand the error message, so i hope you can help
Udklip.PNG

2 replies

23-Emerald I
September 17, 2013

If the radical evaluates to an imaginary number (x = 5 for example) the plot fails.

25-Diamond I
September 17, 2013

Prime plotting capabilities are very limited. As Fred already pointed out Prime would refuse to plot anything if a single evaluated value would be a complex number. The same applies if a division by zero occurs.

One way out is to limit the values for x and y so the radical is positive --> -2.8 <= x,y <= 2.8.

Another approach would be to write a function which traps the division by zero and replaces complex values with NaN's (Not a Number).

Third possibility which comes to mind is to rewrite the function using an appropriate parameter representation if possible.

3DPlot1.png

I am not sure what you mean with level curves, but I guess you would need a contour plot. Contourplots dont work with NaN's so I set all complex values to 1. Unfortunately we cannot mix surfaceplot and countour in one graph or use colormaps as in Mathcad.

3Dplot2.png

1-Visitor
September 17, 2013

hm, looks difficult. Can you refer to an other program which is more convenient?

I have 89-Nspire on my computer, but i cannot figure out how to do it.

25-Diamond I
September 17, 2013

The TI-89 and the TI-NSpire should be able to do 3D-plots and contours. The display quality being the drawback.

You may look it up in the manuals how to do or search the net.

What program to use depends on what you are trying to achieve and what programs you may be able to put your hands on.

Apart from the big players like Mathematica and Maple or Matlab the free program Maxima (or the use of gnuplot as standalone prog) could be considered. Whatever program you choose, it will be necessary in every case to incorporate some time and study the documentation and familiarize yourself with the program.

See below a quick first try using Maxima (with frontend wxMaxima and GnuPlot used for plot output).

gnuplot.png