1-Visitor
November 5, 2020
Solved

Find an equation of a curve between two known curves

  • November 5, 2020
  • 2 replies
  • 5362 views

I have two data sets that I can curve fit to get polynomial equations for. These are 2D data sets for temperatures of 23C nd 65C. I want to find the equation of a curve at 52C based on these two curves. I could interpolate between each value and generate a new data set piece by piece, but hopefully there is a better solution? Any help woudl be greatly appreciated. The data sets are attached in Prime 6.0


Thanks in advance!

Best answer by Werner_E

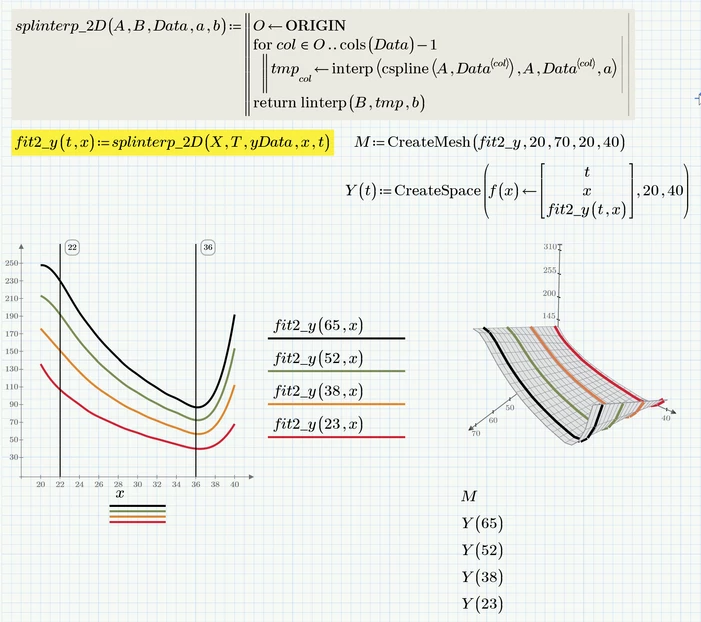
I added spline interpolation to give you an idea what it looks like and why I suggested to stay with linear interpolation.

You could change "cspline" to "lspline" for a less oscillating curve, but I guess that there is no benefit in using spline interpolation.

Werner_E_0-1604607928584.png

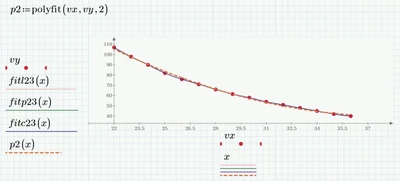
Remark: You talked about "polynomial fit" and even though I called my function (wrongly) "fit" it is NOT a fit but rather an interpolation, no matter if linear or spline. A polynomial fit could be obtained using polyfit, but the resulting curve normally would not run through a single single one of the 15 given data points (unless you chose a polynomial of order 14) but will be a good overall fit. Here an example to fit the data with a simple quadratic parabola:

Werner_E_0-1604611372660.png


One additional remark: Luckily the x values were the same for both data sets (vx=vx65). If the data would have been sampled at different x values, an additional step would have been necessary.


Modified P6 worksheet attached


2 replies

24-Ruby IV
November 5, 2020

May be so

1-2-New.png

24-Ruby IV
November 5, 2020
25-Diamond I
November 5, 2020

Here is an utility function you might find useful.

It uses linear interpolation only and I think thats all you need as you don't gain any value by spline interpolation. But of course it would be easy to replace the linear interpolation by a spline interpolation. Only the first one, as for the temperature you would have to stay with linear interpolation as you only have two values.

Werner_E_0-1604606369208.png

Werner_E_1-1604606419645.png

P6 worksheet attached


Werner_E25-Diamond IAnswer
25-Diamond I
November 5, 2020

I added spline interpolation to give you an idea what it looks like and why I suggested to stay with linear interpolation.

You could change "cspline" to "lspline" for a less oscillating curve, but I guess that there is no benefit in using spline interpolation.

Werner_E_0-1604607928584.png

Remark: You talked about "polynomial fit" and even though I called my function (wrongly) "fit" it is NOT a fit but rather an interpolation, no matter if linear or spline. A polynomial fit could be obtained using polyfit, but the resulting curve normally would not run through a single single one of the 15 given data points (unless you chose a polynomial of order 14) but will be a good overall fit. Here an example to fit the data with a simple quadratic parabola:

Werner_E_0-1604611372660.png


One additional remark: Luckily the x values were the same for both data sets (vx=vx65). If the data would have been sampled at different x values, an additional step would have been necessary.


Modified P6 worksheet attached


1-Visitor
November 5, 2020

Hello Werner,


That is really great and exactly what I was looking for. I also worked this in Excel and did the linear interpolation between the two points individually to generate a new curve, but was not sure how to do this in MathCAD. 


Thanks very much for your help!