1-Visitor
November 29, 2015
Question

Graph of the function - why it is so angular ? How to make it as a normal sinus function ?

  • November 29, 2015
  • 2 replies
  • 1010 views

2015-11-29.png
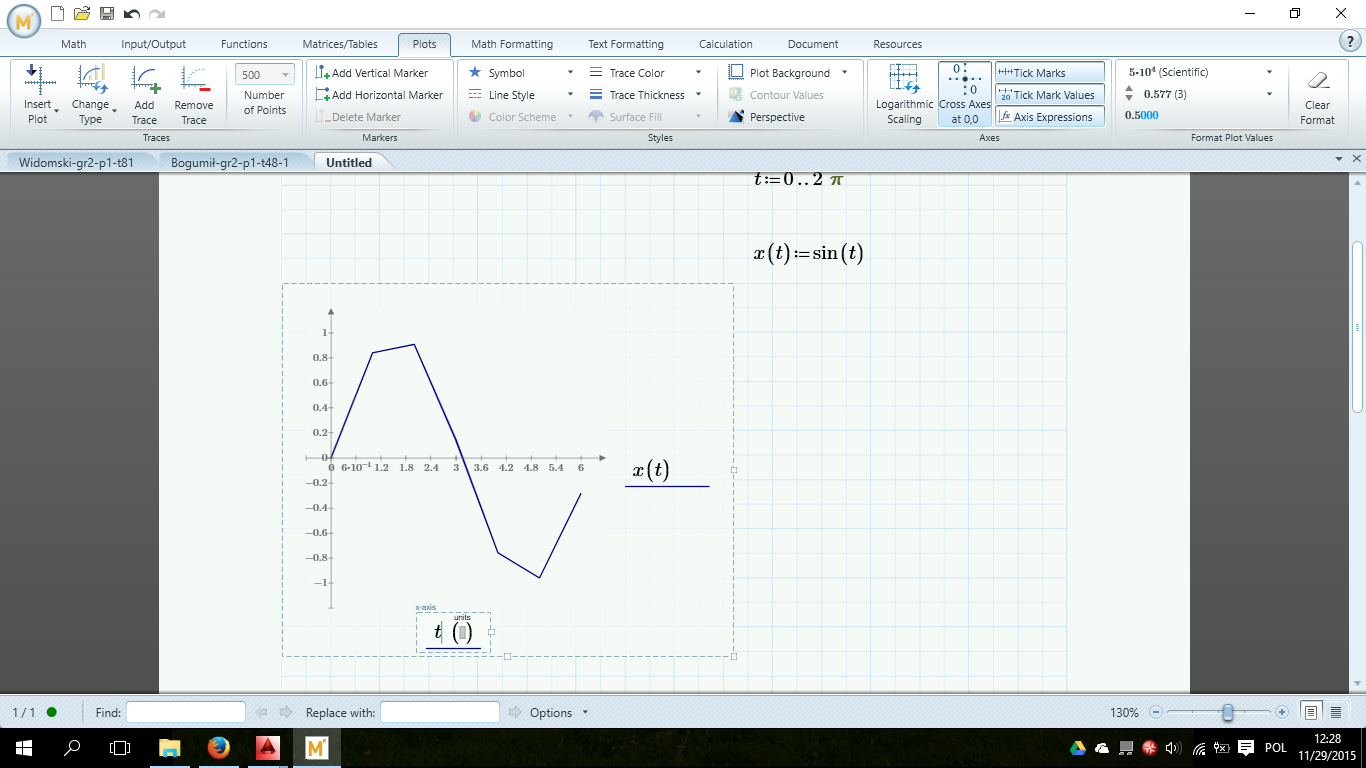
Why it is so angular ? How to make it as a normal sinus function ? Thank You for help.

2 replies

24-Ruby IV
December 1, 2015

Input please

t := 0deg,1deg..360deg

Your range variable, t, is defined without an increment. That means you get the default increment of 1, so t only takes the values 0, 1, 2, 3, 4, 5, 6. Include an increment in the range variable.

t := 0,1.. 6.18    (0, 1, 2, 3, 4, 5, 6 rad - only 7 points on the plot - but needed more)

19-Tanzanite
December 1, 2015

Your range variable, t, is defined without an increment. That means you get the default increment of 1, so t only takes the values 0, 1, 2, 3, 4, 5, 6. Include an increment in the range variable.