11-Garnet
December 19, 2016
Solved

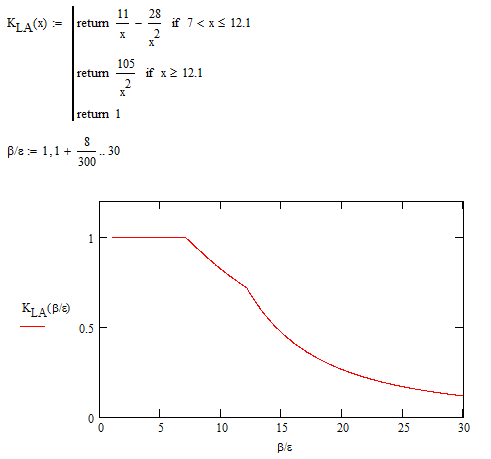
Graph (Variable ratio)

  • December 19, 2016
  • 3 replies
  • 4776 views

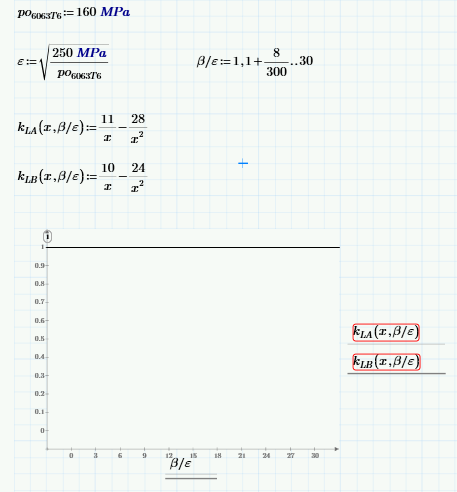
What is wrong with my variable ratio please help me.  I attached the Prime 3.1   file for you to correct my mistake   . I would like to make a graph like what I attached below. I appreciate your full support in advance  . Thank you.

Best answer by LucMeekes

Oh, and if you really want beta/epsilon on the horizontal axis. In Mathcad it can be done:

Don't know if this can be done in Prime...

Luc

3 replies

23-Emerald IV
December 19, 2016

You have an x as well as the ratio beta/epsilon. According to your documentation x=beta/epsilon.

Your functions should need a single parameter: x only. 

Then you get:

Note that there's an erro in the definition of K.L for the case A. The second condition should read X>=12.1 instead of x<= 12.1, because that situation is (partly) covered by the first condition. And the fact that K.L should be 1 when x<7 is not specified, but graphed.

I think you can complete your work now.

Success!
Luc

LucMeekes23-Emerald IVAnswer
23-Emerald IV
December 19, 2016

Oh, and if you really want beta/epsilon on the horizontal axis. In Mathcad it can be done:

Don't know if this can be done in Prime...

Luc

ldante11-GarnetAuthor
11-Garnet
December 19, 2016

Luc  thank you I maked in prime 3.1 like this

ldante11-GarnetAuthor
11-Garnet
December 19, 2016

One more thing what is the shortcut of variable ratio in prime 3.1 ? I just copy and paste the b/e  in my other reference . CTR+Shift + k is not working in prime 3.1

23-Emerald IV
December 19, 2016

I'm afraid it does not exist (yet) in Prime. Wonder if it will ever be supported.

Luc

23-Emerald IV
December 19, 2016

Ah, one last thing.

Mathematically we did one thing wrong (I started, I'll take the blame): what happens in your function if x exactly equals 12.1. I think the second test should be "X>12.1".

Luc