Question
Graphing the same function on Primary and Secondary Y axis with different Units.
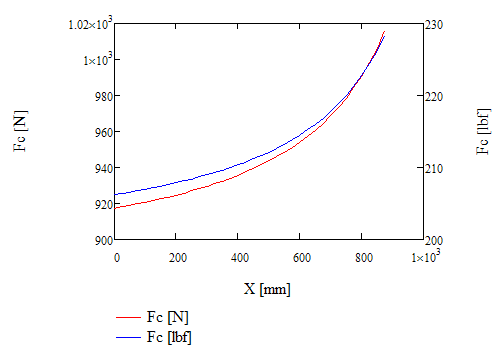
I'm trying to create a graph of a force vs distance graph in MathCad 14 and would like to show the output of the function in both Newtons and Lbf. I have set up the plot with the primary and secondary axis both plotting the same function but returning results using different units. The scaling of the second axis does not match up directly with the primary axis and as such the funtion plots are not co-linear which is visually confusing. Is there a way to have the dual Y axis for different units without plotting the function twice? Or link the scales so that the graphs are the same? In the photo below I would like only one graph but associated with both the primary and secondary axis, with the secondary axis scaled to match the primary.