
Solved
Hepl to make a graph with 3 positive variables
Is this 3 positive variables in a equation are possible to make a graph ?. please help me to solve this in Math CAd prime. I also attached the MATHCAD prime spreadsheet.
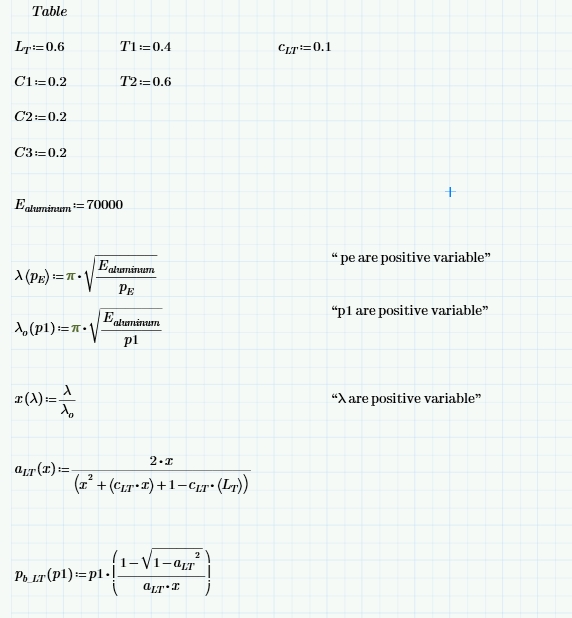
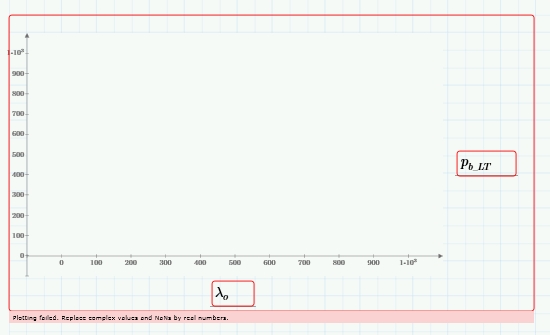

Is this 3 positive variables in a equation are possible to make a graph ?. please help me to solve this in Math CAd prime. I also attached the MATHCAD prime spreadsheet.
Not sure that it's the most esthetic way of doing, but this does *something*.
I am not an expert, but I think you have to (and even if you don't have to, at least, it works this way) use the "fundamental" variables that your stuff are built on to define everything (here, pe and p1, not x and alt).
You also have to define them as range variable for plotting (it might assume range variable on its own, but I wouldn't let the software make that decision for me). In you particular case, you don't have much choise, because the function you want to plot are functions of more than one variable, so I doubt that Mathcad can decide on its own which one you want to do you plot against.
No account yet? Create an account
Enter your E-mail address. We'll send you an e-mail with instructions to reset your password.