
Solved

Maybe you are looking for something like this:
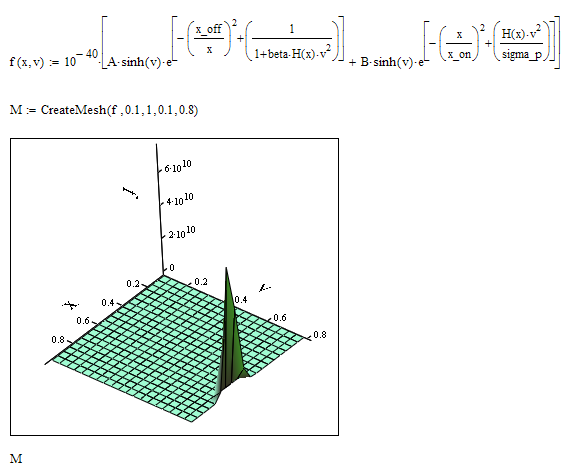
I have scaled the function by 10^-40 because Mathcad refused to turn the ploz and watch it at different angles without.
f(x,v() is shown in z-direction.
Enter your E-mail address. We'll send you an e-mail with instructions to reset your password.