
Solved
How to plot samplings data
Hi. How do i plot samplings data in Mathcad. Something like this:
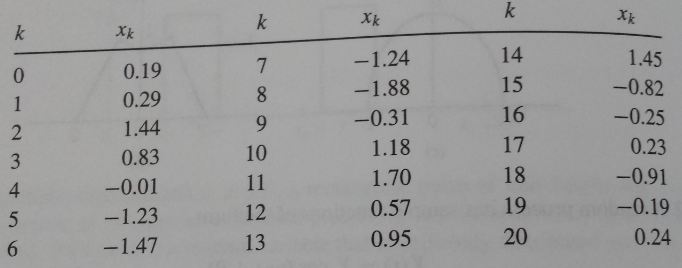
I want to plot all 20 samplings
Thanks in advance

Hi. How do i plot samplings data in Mathcad. Something like this:
I want to plot all 20 samplings
Thanks in advance
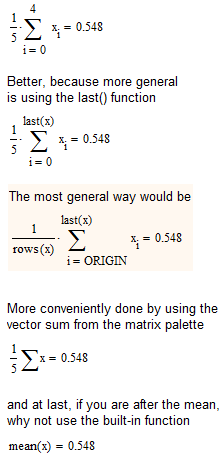
You are adding the vector x 5 times, so you get the 5-fold vector and when you divide it by 5 you end up with the original vector.
What you had in mind was summing up the single elements of the vector you get hold on using the vector subscript ([). But you have to be aware that Mathcad by default would begin indexing with zero, so you would sum up from i=0 to 4.
No account yet? Create an account
Enter your E-mail address. We'll send you an e-mail with instructions to reset your password.