|
I want to plot the 2 equations in mathcad,
|
The problem is that Mathcad unfortunately is not able to plot implicit function. So you have to provide explicit functions or turn the equation into a parametric representation.
Thats definitely not a circle but an ellipse!
|
these examples are used in Find command in mathcad.
|
Find uses an numeric algorithm an will only give you just one solution (depending on the guess values). Sometimes you have luck and the symbolic solve command will give you all solutions.
Here is a variation using just the symbolics (be aware that Mathcad's symbolic abilities are rather limited).
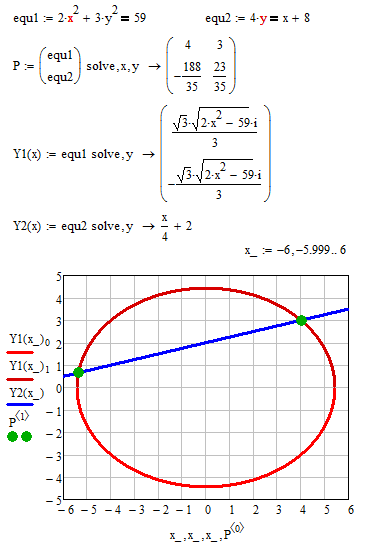
As you can see the ellipse is drawn as two plots (upper and lower half) and I have used a rather dense range variable x_ for plotting to avoid bigger gaps at the joints.
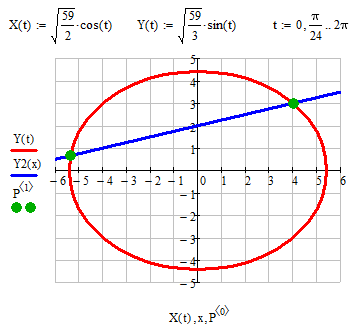
For plotting ellipses its much better to use a parametric representation which I guess cannot be found automatically but of course is well known for an ellipse.
Regards, Werner

