24-Ruby IV
November 13, 2018
Solved

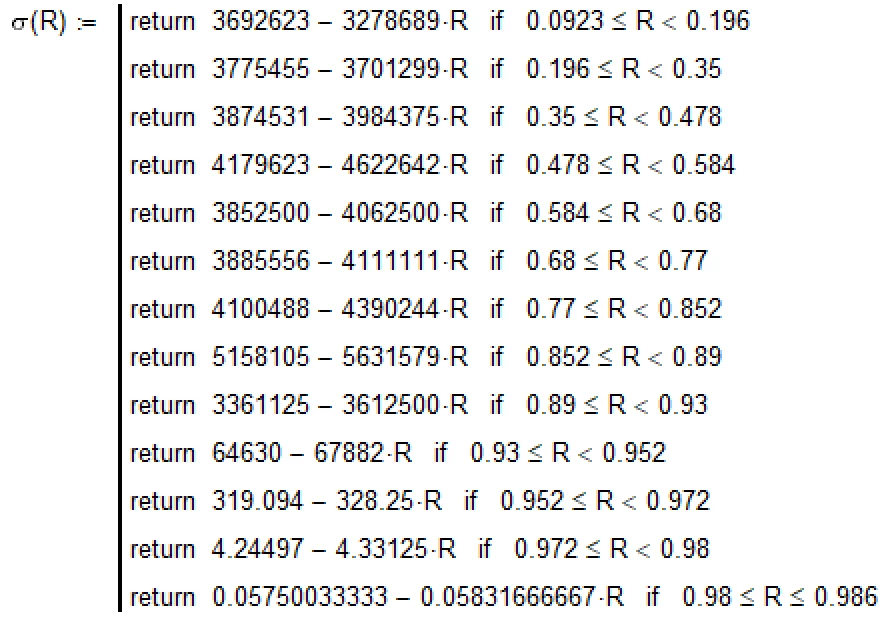
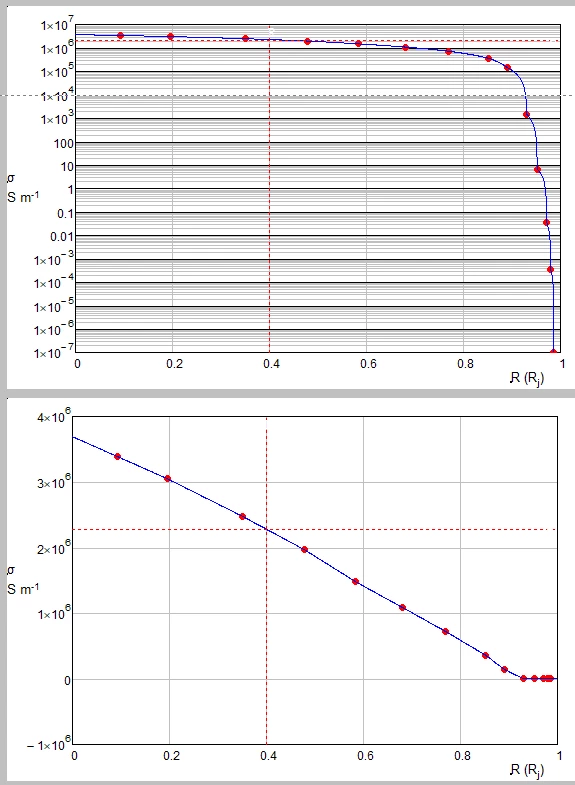
I need a formula for this points

  • November 13, 2018
  • 9 replies
  • 13959 views

Can you show me one formula for this points? The Mathcad 15 sheet is in attach!

Thank you!
R-Sigma.png

Best answer by ValeryOchkov

From the very beginning, I was thinking about this Columbian solution, but I expected a more elegant (smoother, with derivatives!).

CS.png

PS

What is it one Columbian solution&

They say that Columbus during lunch with Cardinal Mendoza suggested that the present grandees solve a simple problem: put an egg upright on the table. No one could do this, except for Columbus himself - he just broke it from one end. All, interrupting each other, began to resent that so can they. “The difference is, gentlemen, that you could do it, but I actually did it,” the navigator replied.


9 replies

23-Emerald I
November 13, 2018

I'm limited by lack of version 15.


Attached is excel of three fits (curve expert) of digitized data.  No good fits, best fit doesn't roll off fast enough, others go negative at high R.


(If you send a cxv file of point values, I can try gain. (You've got my email.)


good luck!

16-Pearl
November 13, 2018

Way back in 1993 or so I had a program, I believe called NFIT.  It had several hundred formula built-in that you could cycle through and (usually) find a good fit.  I lament that in 2018 I can't seem to find a similar program.  

23-Emerald I
November 13, 2018

Google curve expert.


Program has many built-ins, and will accept you own special function.

14-Alexandrite
November 13, 2018

I second Curve Expert.  I wish Mathcad had that kind of curve fitting capability.

21-Topaz II
November 14, 2018

Hi,


The first points are very nearly a straight line,  So curve can be broken into two parts.  You could possibly get closer to the last eight points with a different function type besides a line.

Capture.JPG

24-Ruby IV
November 14, 2018

Thanks to all!

At our university there was a mathematician who by the type of curve immediately determined the formula f(x,a,b,c…). With guess values for a, b, c... But he, alas, retired!

I need the formula for C++! But at first for Mathcad!

MathMan.png 

23-Emerald I
November 14, 2018

Your plot looked a bit like a low pass filter.


So, with a little sleight of hand. . .


In Prime 4 express

23-Emerald I
November 14, 2018

Capture3.PNGCapture.PNGCapture2.PNG

24-Ruby IV
November 14, 2018

The sheet please!

16-Pearl
November 14, 2018

Here's something called Regression Kink Design; seems to be popular in economics.  Does a reasonable job.  It does undershoot the lowest points if you zoom in.  I could only go to 6th order since that's when minerr ran out of variables.


2018-11-14_8-39-57.jpg

24-Ruby IV
November 14, 2018

Cooooooooooooooooooooooooooooooooooooooooool!

MathManCool.png

25-Diamond I
November 14, 2018

In your initial post you show a plot with the y-axis log scaled. Is this what you need?

Then you have to be aware that the quite interesting solution of DJF will only give you what you need for the first part of your data, similar to what Terry had provided. You would need another function for the second part!

B0.png

Guess you attached that log-scaled pic to show that you don't like that bumpy look when using linear interpolation, right?

So why not use linear interpolation of the logarithmized data. This should be easy enough to implement in C++ even though its not one single function equation.

B1.png

You may also use splines, but I guess there's no benefit doing so and its quite a bit more work to implement in C++.

B2.pngHere is an example that a fit (a regression in that case, not an interpolation) which looks quite OK with log-scaled axis, is horrible when plotted without log-scaling.

B3.png

23-Emerald I
November 15, 2018

@ValeryOchkov wrote:

Can you show me one formula for this points?


log plotlog plotlinear plotlinear plotdoes not go negative


16-Pearl
September 19, 2019

I felt we never got a great solution to this one so I've poked at it occasionally.  Here's an approach that uses Butterworth filters to allow the combination of 3 unique curve fits.  Still not perfect, but an interesting approach to have in your toolkit.  The filters multiply the various fits by a square wave (~1 or 0) to turn them on or off as we progress along the X axis.  In the end it's not much different than Fred's approach, but can help smooth the transitions.

2019-09-19_9-05-24.png

2019-09-19_9-13-46.png

4.0 attached.

16-Pearl
September 23, 2019

I followed Fred's advise and got CurveExpert.  It is ....ok.  Works fine but a bit disappointing in the number of built-in equations it has.  Continuing my search I then found http://zunzun.com/


It will brute force it's way through hundreds of equations, and it's free.  I also contacted the site author and he made some fast updates for me.  It didn't find a good solution to Valery's problem, but it's worth bookmarking.  Bit confusing to use and slow, but seems very powerful.

Instructions:

Select 2D function finder

Paste in you data as text (into "text data editor" pull-down)

Continue to scroll through the various pull-down screens to select the options you want.

Hit submit (and wait a while, ~30 minutes if you're looking at all equations) 

Equations come back ranked and plotted