
1-Visitor
January 10, 2013
Solved

Identifying stationary and transient behavior of data in Mathcad

  • January 10, 2013
  • 18 replies
  • 5298 views

Hello!

I have started working with Mathcad recently and I have been trying to "filter" my data in order to separete stationary and transient behaviors.

My data is a two-collum matrix with time and temperature. I need to identify the begining and the end of a start up of a system, which will result in an increase of temperature and afterwars the temperature will be stationary.

Has anyone tryed that before with Mathcad??

Thank you for your attention.

Best Regards,

Bruno
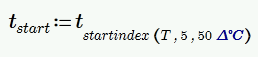
Best answer by Werner_E

I have added units, as Valery suggested.

Is there a way to avoid having to specify the threshold (temperature difference) in Kelvin instead of the preferred degree Celsius?

Sorry, found it myself:

transient4.png

Added this and edited the sheet to reflect a possible change of ORIGIN in all expressions (the separation of the data in t and T was not ORIGIN-aware in the previous sheets).

18 replies

23-Emerald I
January 10, 2013

You've come to the right place.

Can you post an example of what you've tried so far? (Click "Use advanced editor" on the top right to post a file.)

bcardoso1-VisitorAuthor
1-Visitor
January 10, 2013

Dear Fred,

Right now my file is very messy. I will clean it up to post it as soon as possible.

Thank you for your attention.

Bruno

24-Ruby IV
January 10, 2013

I think you can at first to create a plot on your data an see.

bcardoso1-VisitorAuthor
1-Visitor
January 11, 2013

Hello,

As you asked, I am sending the plot of my data.

I had a first experience with Mathcad 14 and this is my first file with Mathcad Prime 2.0.

I was speaking with some colleagues and they suggested that I tried a "moving window" method in which I would check my data for a given instance of time, t, then, I would subtract the value of the t+4 (ie. the data ahead of the one I am checking) of the value at t and if the result is higher than a specified value that I determine, I could identify the beginning of the start up.

Example:

At t=5minutes, my temperature is 300ºC, I would compare it to when t=20minutes (assuming I am collecting data at every 5 minutes) and that at t= 20minutes the temperature is 350. If I set the difference to 20ºC, the filter would have to identify this as the start of my start up.

The thing is that I do not have much experience in programming. Maybe you guys can check if the logic is correct and maybe give me some tips or an alternative way to make this or even any file that you may have done something similar.

Thank you very much for your attention.

Regards,

Bruno

24-Ruby IV
January 11, 2013

Some one so:

time-series.png