

1-Visitor
July 16, 2014
Solved

Is it a bug of MC15M030?

  • July 16, 2014
  • 5 replies
  • 1836 views

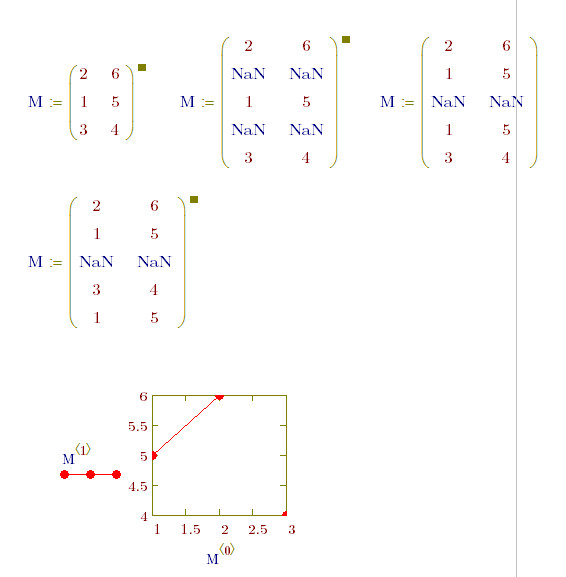
I want plot a matrix with two columns which contains a NaN point by 2D line plot in MC15M030, and like the picture below:
2014-07-16_232115.jpg

the last two points has not line between them, and when I change the order of the two points,
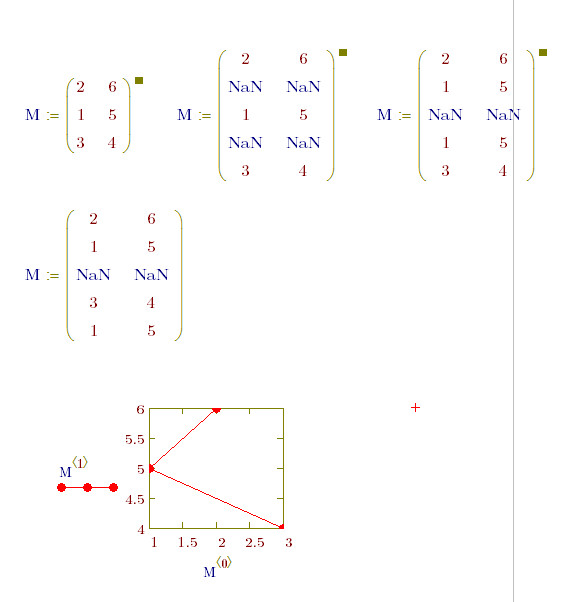
2014-07-16_232748.jpg

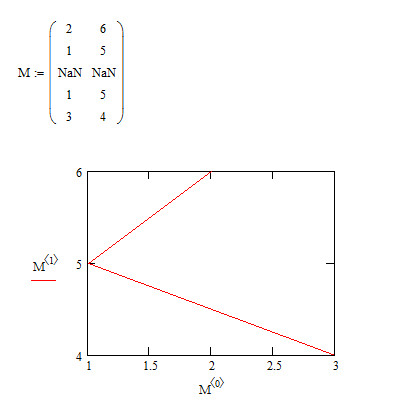
then the line appears. And I try to plot the first picture in MC11, the result is right.
2014-07-16_230352.jpg

Is it a bug of MC15M030?

Best answer by Werner_E

I would call it a bug, yes.

The problem is not primarily the order. I think rather the problem occurs when there is the very same point before and after the NaN's.

Nevertheless I agree that it should work.

A workaround is to set the trace type frome "lines" to "draw", but you loose the points at the vertices if you do.

Ad MC11: I thought NaN was not available there?

EDIT: Ah, think NaN was introduced with MC 11.1, right?

5 replies

Werner_E
Werner_E25-Diamond IAnswer
25-Diamond I
July 16, 2014

I would call it a bug, yes.

The problem is not primarily the order. I think rather the problem occurs when there is the very same point before and after the NaN's.

Nevertheless I agree that it should work.

A workaround is to set the trace type frome "lines" to "draw", but you loose the points at the vertices if you do.

Ad MC11: I thought NaN was not available there?

EDIT: Ah, think NaN was introduced with MC 11.1, right?

1-Visitor
July 17, 2014

Werner Exinger 编写:

A workaround is to set the trace type frome "lines" to "draw", but you loose the points at the vertices if you do.

Oh! It works! Very thank you Werner. I have read a datasets with some NaN points and plotted it in line on MC, and I don't want any break in the line, and then found this matter.

" I think rather the problem occurs when there is the very same point before and after the NaN's.", yes, it really the matter.

12-Amethyst
July 17, 2014

I tried a few variations, and I think It's not the befroe and after NAN coordinate values per se, but rather the physical separation of the points on the resulting screen plot. For the same before and after coordinates, the resulting plot shows only one point of the second line segment regardless of plot size. When the before and after coordinates define distinct points, the second line segment will be plotted if the before and after points are "sufficiently" apart. This depend on the plot size and scale, as the plots in the attached file show. Two plots of the same vectors, differning in plot size only, show different results.

There is no bug in mcd11.2a at all as far as I've seen here (and in using it for many years). The results shown are in mcd15-M020.
