Solved
Is it possible to interpolate the scattered data in 2D?
Hi All,
I am new to this community. Forgive me if my question has been answered somewhere.
I have a 2D data set, but the sampling points are not on the regular Cartesian grid.I would like to rearrange the sampling point by interpolation and generate a new table with Cartesian grid.It looks MatLAB or IDL guys use a function called “griddata”.
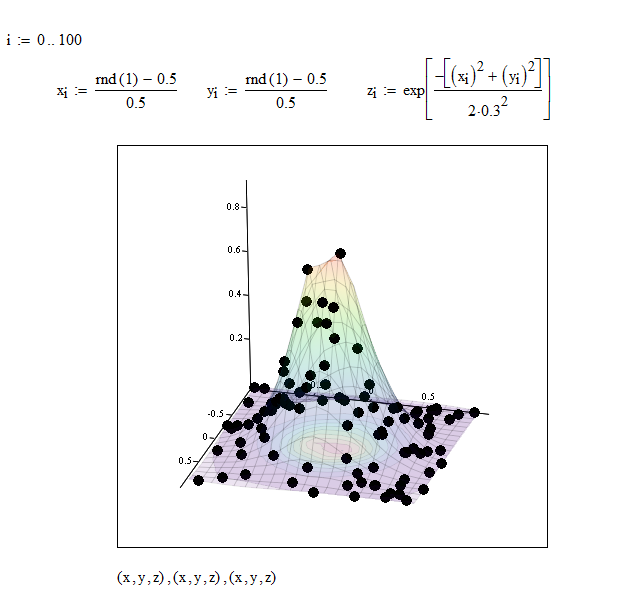
However, when I make a surface plot or contour plot, MathCAD is interpolating the scattered data and making Cartesian data set. So the MathCAD already have something equivalent to griddata.
I am wondering if someone know MathCAD function or routine which does something equivalent to griddata.