
Solved
Label inside a 2D plot
Hi all,
I use MC15 and my question is "how you can write a label/tag near a specific point on a graph".
Example: I have a function f(x) and I want to write something near the point f(x=26).
Regards

Hi all,
I use MC15 and my question is "how you can write a label/tag near a specific point on a graph".
Example: I have a function f(x) and I want to write something near the point f(x=26).
Regards
You can do it (in a rather unsatisfactory manner) by writing your label in a text box and then dragging this onto the graph, as has been done in the image below. You can't get Mathcad to label points automatically though.
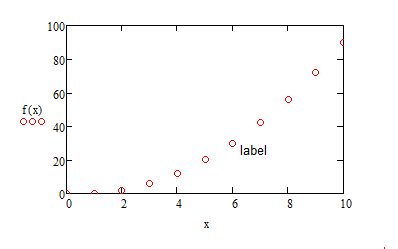
Alan
No account yet? Create an account
Enter your E-mail address. We'll send you an e-mail with instructions to reset your password.