
Solved

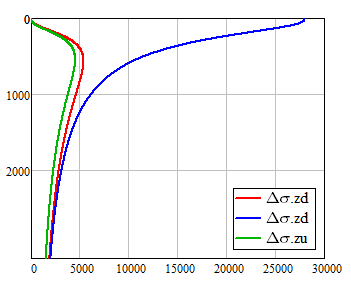
z is NOT a range variable in your sheet!
Mathcads quickplot feature would work only for an undefined variable at the abscissa, not the ordinate.
So if you want the independent variable z at the ordinate, you have to define a range variable for z to make it work.
Welcome to the PTC Community
No account yet? Create an account
Please use your PTC eSupport account.
LoginEnter your E-mail address. We'll send you an e-mail with instructions to reset your password.