1-Visitor
March 9, 2013
Solved

Make "too large to display" a function so I can use it in plot?? mathcad attached

  • March 9, 2013
  • 14 replies
  • 4587 views

I need help!

I have I long equation, and I am trying to solve for one of the variables in the equation:

K=f(a,W,K) --> solve for K, to make K=f(a,W).

I have attached the mathcad.

The solution for my solve function is too big, but I need to use this solution to create a plot. How do I do this??

Thank you!!!

Best answer by Werner_E

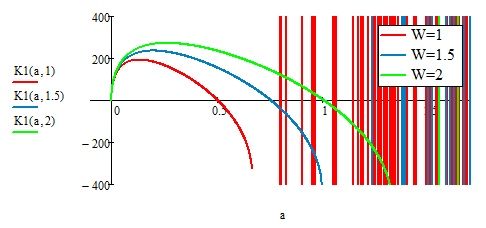
If the goal is plotting and tables of values, there are resonable numerical solutions using "root" or "Find"available. The reason for those "artefacts" we see when using root for a values greater than 2*W/3 are due to the fact that root delivers real roots for selected single values where it should return a complex number, I guess. So I think the graph produced with the sollve block is the correct one and function K1 should be rewritten to return NaN if a is greater than 2*W/3.

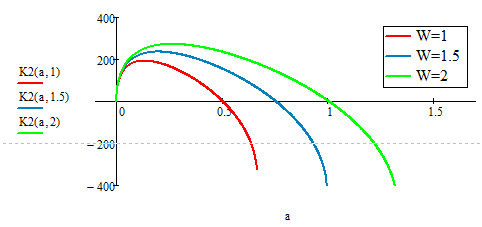
Another question. How can I add the errorhandling to K2 as I did it with K1. Do I have to define another function which is then asigned to K2?

  • Using the "root" function

too_long_2.png

  • Using a solve block with "Find"

too_long_3.png

Edited: Changed attached file, include modified solution with root (as decribed above) now

14 replies

Werner_E
25-Diamond I
March 10, 2013

without units and using a substitution Mathcad is able to show the result, but I guess I won't make you happy. Due to the nature of the solution it cannot assigned a function. Details see attached.

Are you sure that solve should find a compact, unique solution?

1-Visitor
March 10, 2013

I try to substitute it, but it can not work, even I try to substitute the simple one, it can not work too.

substitutenotwork.jpg

Werner_E
25-Diamond I
March 10, 2013

Look if the attached (based on the idea in a post of 朱 欣研 which seemed to have been deleted) makes sense.

Caution - takes quite a while to evaluate

too_long_1.png

1-Visitor
March 10, 2013

hehe, because I think the method of exhaustion maybe no efficency on this problem, so I have deleted the reply...

I'm use another method, simplify it by hand, and use W=1, plot K(a,W)--a/W, seemly it only one point on it...Maybe wrong.

help2%281%29.jpg

help2%282%29.jpg

Werner_E
25-Diamond I
March 10, 2013

Not that much of value without the sheet (as mine, as I forgot to include it).

Look at the range for a and K in my solution and throw that in yours. Maybe you will see more than one point then.

After all - if you are going for a sulution using the "brute force" way with those nested for loops, it would not be necessary to make that long winded manual simplification and substitution process anyway.

Werner_E
Werner_E25-Diamond IAnswer
25-Diamond I
March 10, 2013

If the goal is plotting and tables of values, there are resonable numerical solutions using "root" or "Find"available. The reason for those "artefacts" we see when using root for a values greater than 2*W/3 are due to the fact that root delivers real roots for selected single values where it should return a complex number, I guess. So I think the graph produced with the sollve block is the correct one and function K1 should be rewritten to return NaN if a is greater than 2*W/3.

Another question. How can I add the errorhandling to K2 as I did it with K1. Do I have to define another function which is then asigned to K2?

  • Using the "root" function

too_long_2.png

  • Using a solve block with "Find"

too_long_3.png

Edited: Changed attached file, include modified solution with root (as decribed above) now

1-Visitor
March 10, 2013

The herizontal ordinate of the plot is a/w, thus K(a,1.5), is a/1.5, and k(a,2), is a/2, OK?

Werner_E
25-Diamond I
March 10, 2013

If you plot with a/W on the ordinate and K(a,W) on the abscissa you will get a lot of graphs which cover/overlap/are identical with the red one (for W=1). So nothing new. This of course only applys if its possible at all to make the function dependable of the ratio a/W alone, which does NOT seem to be the case here as the graphs show. So either K is not supposed to be dependent of the ratio a/W or the original poster should check the formulas in my file against the one in his sheets.

too_long_4.png

1-Visitor
March 10, 2013

Wow you guys are great. I never expected this much help!!

K is only a functon of sigma, a, and W. I am given the instruction to plot K vs. a/w. The plot I am creating is supposed to prove that the K function does not rely on the first bit:

W-2(a+rp)/W

This is why, I believe, we are getting the different scales for a/W.

I believe this is exactly what I need! Thank you!!!

Also - I should have noted this before - the domain is only between a/w = 0-0.5