MIT 6.003z Signals and Systems
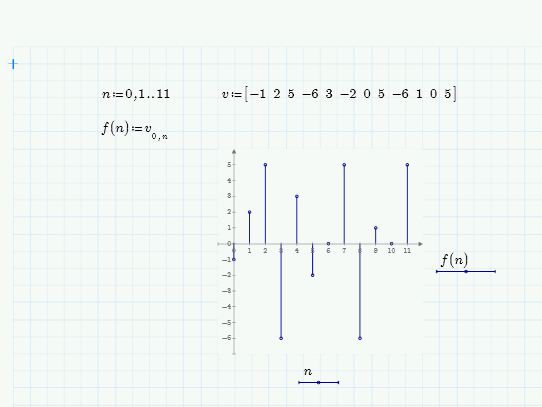
I passed MIT 6.002x and have been following the development of 6,003z "Signals and Systems." Although 6.003z is past Week 10, I'm still at Week 2, trying to figure out how to make Mathcad Prime 2.0 do my homework. The software has a plethora of functions under FUNCTIONS, SIGNAL PROCESSING on the menu bar, but very little help on how these functions can be used. So I'm still working on ways to generate lollipop plots of discrete signals. You can't use the traditional f[n] because brackets have other purposes in Prime 2.0. But that's not a real problem. I use f001(n) to define a number of discrete signals. Is anyone else having fun with lollipop plots (aka stem plots)? Can anyone explain to me how to tell the difference between vectors and arrays which are actually scalars? There must be an easier way than what's shown below.