
1-Visitor
March 16, 2013
Solved

Obtainig intermediate results

  • March 16, 2013
  • 7 replies
  • 3485 views

In advance excuse me for my poor english I'm Spanish.

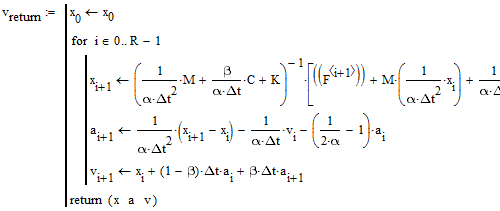
Hi everyone, I'm programming a Newmark's Method and I have some trouble trying to obtain the intermediate results for my program, currently the program only shows the last value of the variables, and I want to ask you some help to be able to obtain and then to plot each of the results for each step.

Thx a lot guys!
Best answer by Werner_E

Maikel Nite wrote:

currently the program only shows the last value of the variables

This is because while you calculate and keep all results, you return only the values with the last index (i+1). Just omit the indices in the return statement and you get all four steps.

I noticed two other things, though. The break is without function as you compare a three element vector (x[i) to a constant (R=3). The whole inner for-loop(j) seems to be obsolete as you just calculate and assign the same values three times the way you did it. What did you intend?

and then to plot each of the results for each step.

What would you plot with just three iteration steps and which variable against which?

intermed1.png

BTW, no need to crosspost.

7 replies

Werner_E
Werner_E25-Diamond IAnswer
25-Diamond I
March 16, 2013

Maikel Nite wrote:

currently the program only shows the last value of the variables

This is because while you calculate and keep all results, you return only the values with the last index (i+1). Just omit the indices in the return statement and you get all four steps.

I noticed two other things, though. The break is without function as you compare a three element vector (x[i) to a constant (R=3). The whole inner for-loop(j) seems to be obsolete as you just calculate and assign the same values three times the way you did it. What did you intend?

and then to plot each of the results for each step.

What would you plot with just three iteration steps and which variable against which?

intermed1.png

BTW, no need to crosspost.

1-Visitor
March 17, 2013

Thank you very much for answering so fast. It worked changing the program as you told me.

and then to plot each of the results for each step.

What would you plot with just three iteration steps and which variable against which?

What I want is to take the first number in each vector for example x vector and represent it against time.

what I'm modelling are 3 masses that are related (not yet implemented that in the program) so I want to be able to plot the x position at each time step. Each vector (x for example) has the 3 masses involved so now I would like to be able to plot how mass 1 evolves along time so with mass 2 and 3.

If you could help me again I would appreciate.

Thx in advance.

BTW you're right, I don't really need the break line.

Werner_E
25-Diamond I
March 17, 2013

Maikel Nite wrote:

Thank you very much for answering so fast. It worked changing the program as you told me.

and then to plot each of the results for each step.

What would you plot with just three iteration steps and which variable against which?

What I want is to take the first number in each vector for example x vector and represent it against time.

what I'm modelling are 3 masses that are related (not yet implemented that in the program) so I want to be able to plot the x position at each time step. Each vector (x for example) has the 3 masses involved so now I would like to be able to plot how mass 1 evolves along time so with mass 2 and 3.

If you could help me again I would appreciate.

Thx in advance.

BTW you're right, I don't really need the break line.

Ok, but what time? I noticed you had defined a range variable with 601 elelemts for it but you did not use it in your iteration. Nevertheless you used the Delta_t.

Attached find the plot of the three masses along with the three iteration steps, but I guess thats not what you are looking for, right?