Solved
Periodic Function Plotting
Hi
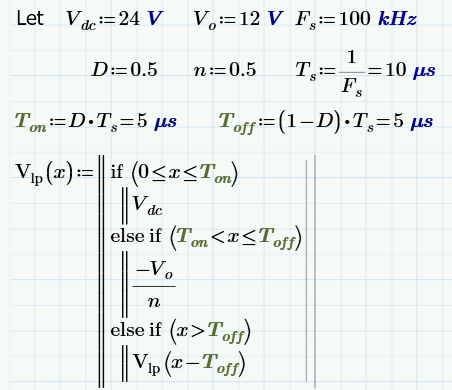
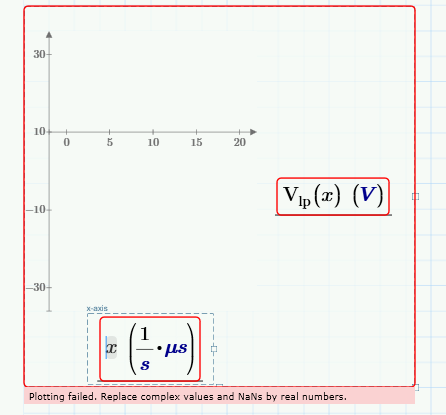
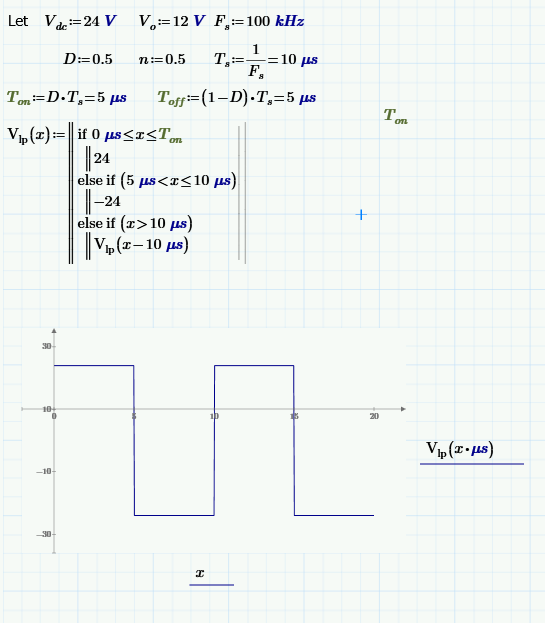
I have been through many posts but i am not able to plot the attached expression. Can you please tell where i am doing mistake?I am expecting a periodic square waveform toggling between +/-24V with on and off period 5us.
Here I used Ton,Toff as a cons; x as a variable and Vlp(x) as a function.
<Unfortunately when instead of Variables I used to substitute assigned Numerical value it works>