1-Visitor
May 7, 2017
Question

Phase of a Transfer Function

  • May 7, 2017
  • 3 replies
  • 3156 views

Hi,

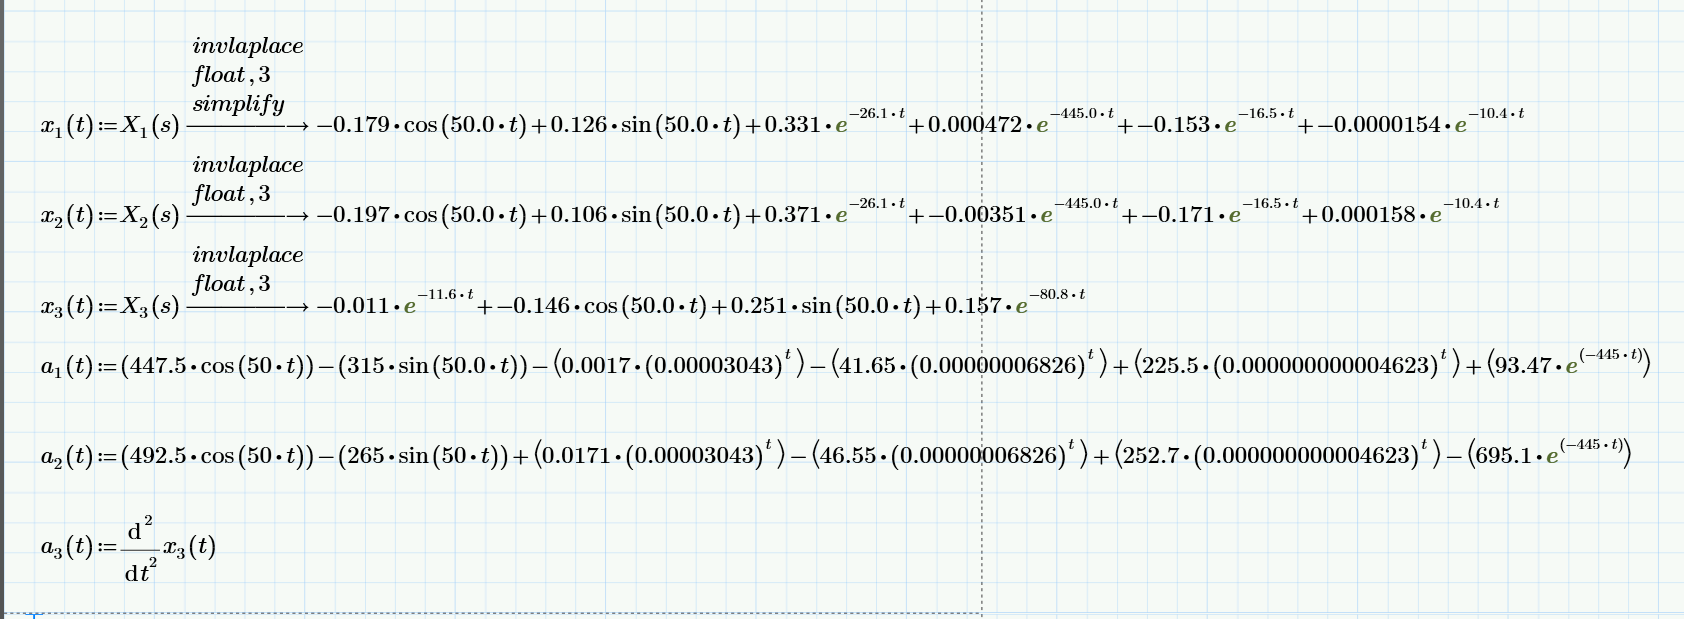
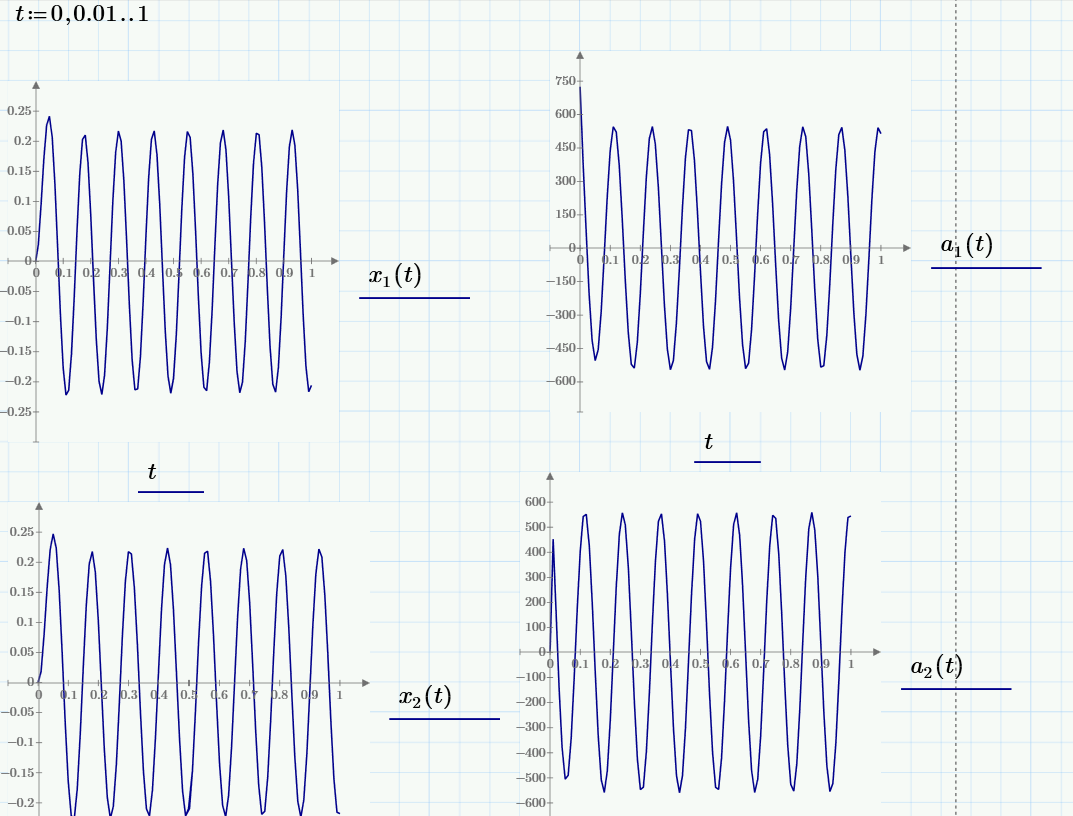
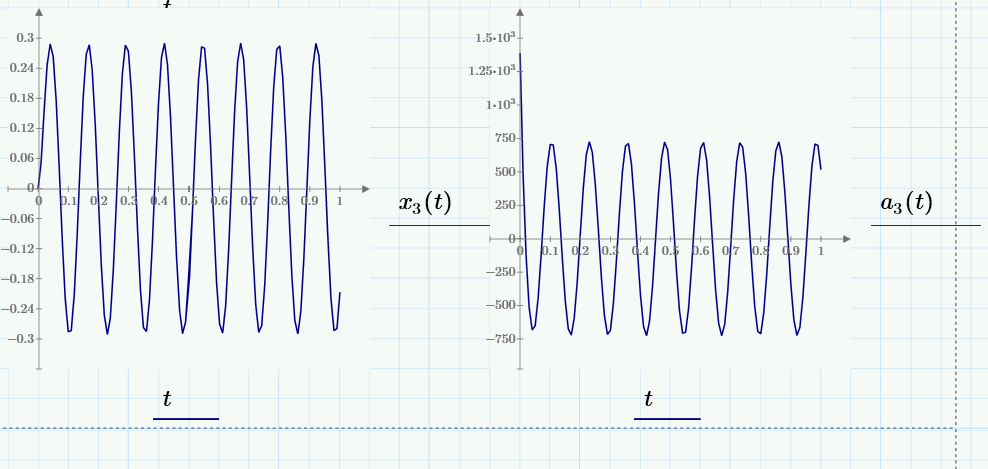
I am new to Mathcad, and I am using Mathcad prime 3.0. I need to plot the phase of my transfer function and am lost where to start. Here is what I have. Phase 1.PNGPhase 2.PNGPhase 3.PNGPhase 4.PNG

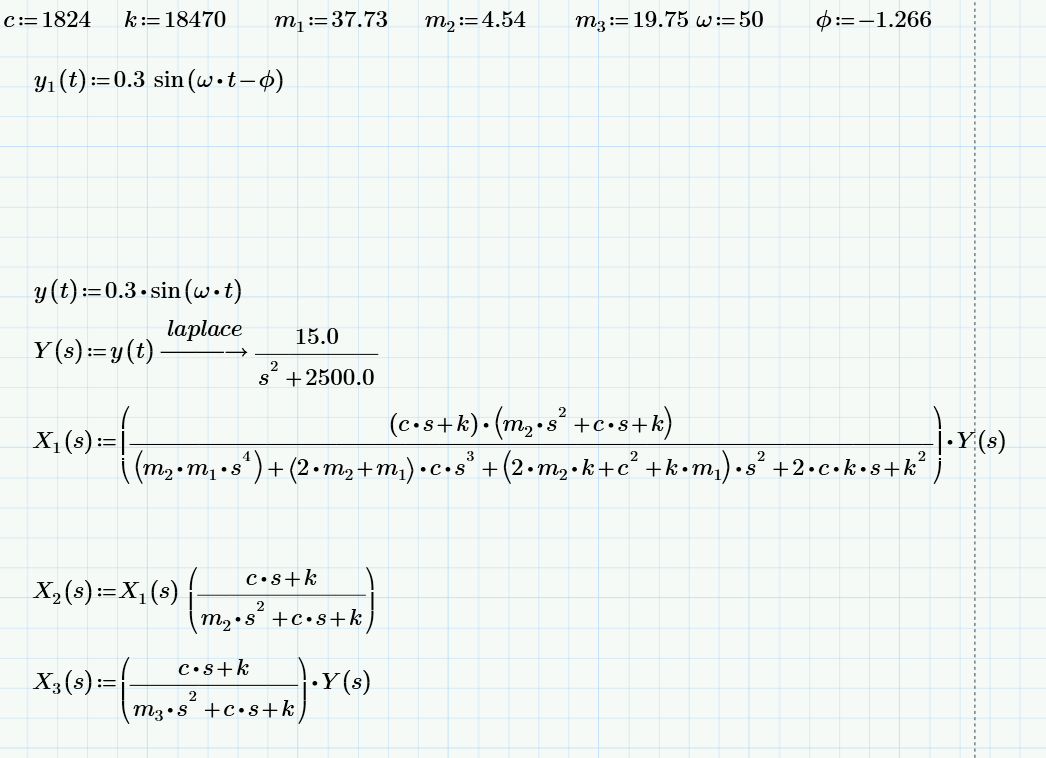
Any help would be greatly appreciated! Thanks.

3 replies

21-Topaz II
May 8, 2017

transfer function.jpg

25-Diamond I
May 8, 2017

I was not aware that "arg" and even "Re" and "Im" are considered "Premium" features.

But you can create your own function using "atan2" and the complex conjugate, as they are not premium:

23-Emerald IV
May 8, 2017

"was not aware that "arg" and even "Re" and "Im" are considered "Premium" features."

Ah, I reported that a year ago Re: Plotting/calculating transfer functions.

Thanks for the tip on arg().

Luc

23-Emerald IV
May 8, 2017

I't usually better to attach the Prime file (along with any pictures). To attach the Prime file use the Action => edit entry ( lower left corner of your post) and then you will see an Attachment option at the lower left side of the edit window.

So, I see a lot of definitions and functions, but which is the transfer function that you want to plot the phase of?

Luc

25-Diamond I
May 8, 2017

I won't retype all your expression, so here is just a small example including grid lines.

Attached file is in Format Prime 3.1