

Solved
Pi Day Fun Facts with PTC Mathcad
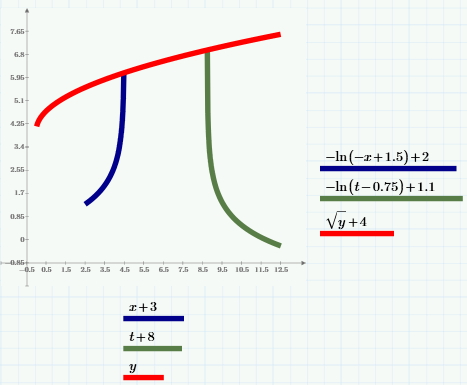
When i set the formula to "-In(t-0.75)+1.6", the green line will beyond the red line.
Why my Pi graph is "-In(t-0.75)+1.1", not like the PTC Mathcad official graph shown in the following second picture?
http://www.ptc.com/mathcad-software-blog/pi-day
