1-Visitor
August 14, 2012
Solved

Please help - need to plot a function

  • August 14, 2012
  • 2 replies
  • 4968 views

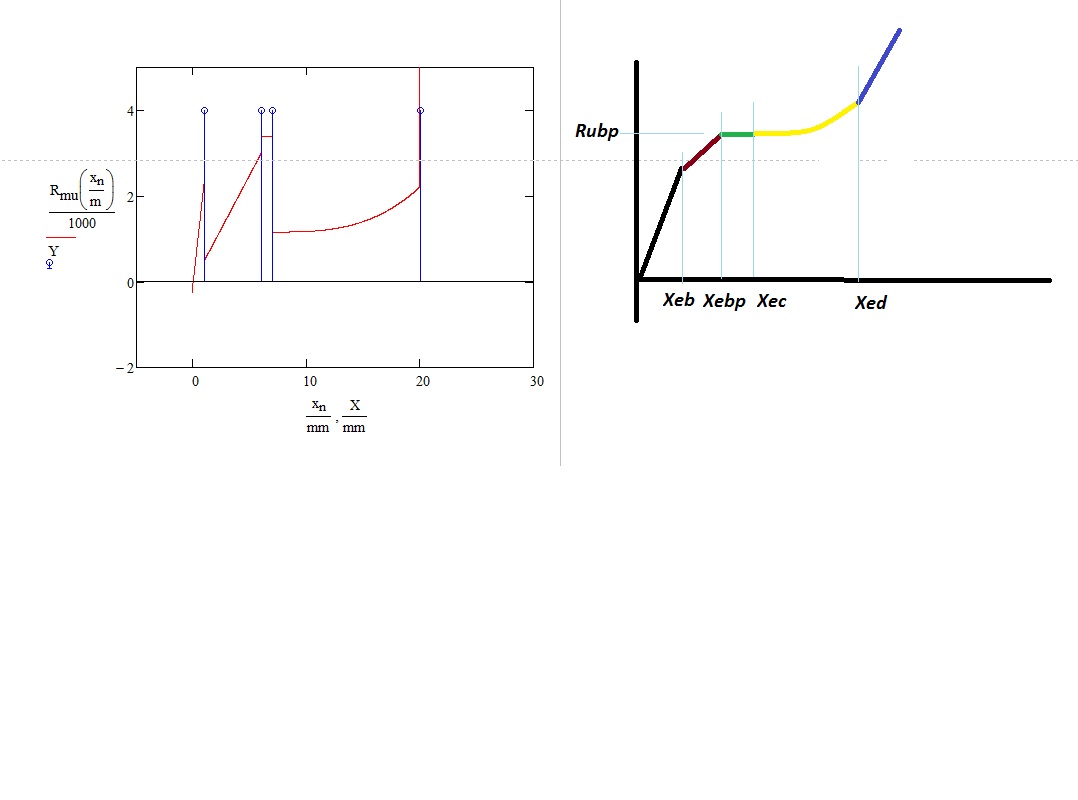
Hi, attached are two models - Model function A and B. Each model function consists of parts that i am superimposing with given boundary conditions. However, when i plot each function i don't believe it is plotting the mathematical function for either Model A or Model B. I attach, if anyone can please help me to plot the functions correctly would be much appreciated (it's possible that my actual functions are not written correctly in matchcad). Thank you.

Best answer by uclphd

Hi Stuart, I don't think there is any need to divide by N. The plot you provide doesn't seem to connect each bounded portion of the curve from it's end point - however it does provide each individual portion/bound correctly. I have sketched next to your curve what i'd expect - does this seem reasonable with the functions i have provided? Thanks , OmarFunction_model_B_02.jpg

2 replies

24-Ruby IV
August 14, 2012

Is it a beam?

Send please the picture of your beam!

uclphd1-VisitorAuthor
1-Visitor
August 14, 2012

It is a Beam, however the problem is related to the mathematical function regardless of the structure. Thanks.

1-Visitor
August 14, 2012

You have used <= at both ends of your length booleans; this means that you will be counting the end points twice. You need to change one of the limits to < rather than <=.

Stuart

uclphd1-VisitorAuthor
1-Visitor
August 14, 2012

Hi stuart. Thanks for your suggestion but when i change the booleans as you suggest it makes no difference to what is being plotted. can you send an example of what you did? perhaps i'm missing something. Thanks

1-Visitor
August 14, 2012

Sure, see attached, Omar. Out of interest, why do you think your implementation looks wrong? What do you expect?

Stuart