Best answer by Werner_E

@ppal_255687 wrote:

Thats good. But when leg = 3 it should put the point on the "Y" axis.


How can you expect a point (different from the origin) on the y-axis if you write a zero at the y placeholder???

Are there any more cases to come? leg=0, leg=4,5,... ?? What should happen if leg=6 or leg=-2 ?

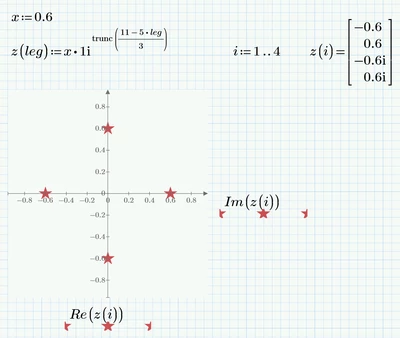
You can make your function to return an appropriate 2x1 vector and plot its y-component over its x-component.

Or you may consider using appropriate complex numbers and plot Im(z) over Re(z).
Werner_E_0-1667876027913.png

3 replies

25-Diamond I
November 7, 2022

Its unclear to me what you are trying to achieve. What kind of plot do you expect?

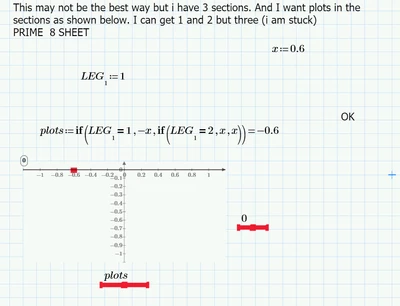
Your nested if's work OK but as you wrote it, "plots" gets the very same value (x=0.6) for LEG=2 and also for LEG=3 (and any other value different from 1)  and  so you see the very same plot (its just one point of course).

In the pic below I changed the value which is returned for LEG=3 (better: for any value of LEG not 1 or 2) to x/2

Werner_E_0-1667805920176.png


ttokoro
21-Topaz I
21-Topaz I
November 7, 2022

image.pngimage.png

t.t.
23-Emerald I
November 7, 2022

I've reworked your sheet.  Sorry if I misunderstood! 

18-Opal
November 7, 2022

Thats good. But when leg = 3 it should put the point on the "Y" axis.

Werner_E25-Diamond IAnswer
25-Diamond I
November 8, 2022

@ppal_255687 wrote:

Thats good. But when leg = 3 it should put the point on the "Y" axis.


How can you expect a point (different from the origin) on the y-axis if you write a zero at the y placeholder???

Are there any more cases to come? leg=0, leg=4,5,... ?? What should happen if leg=6 or leg=-2 ?

You can make your function to return an appropriate 2x1 vector and plot its y-component over its x-component.

Or you may consider using appropriate complex numbers and plot Im(z) over Re(z).

Werner_E_0-1667876027913.png