
Question
Plot: How to adjust graduations (or tick marks) of y-axis ?
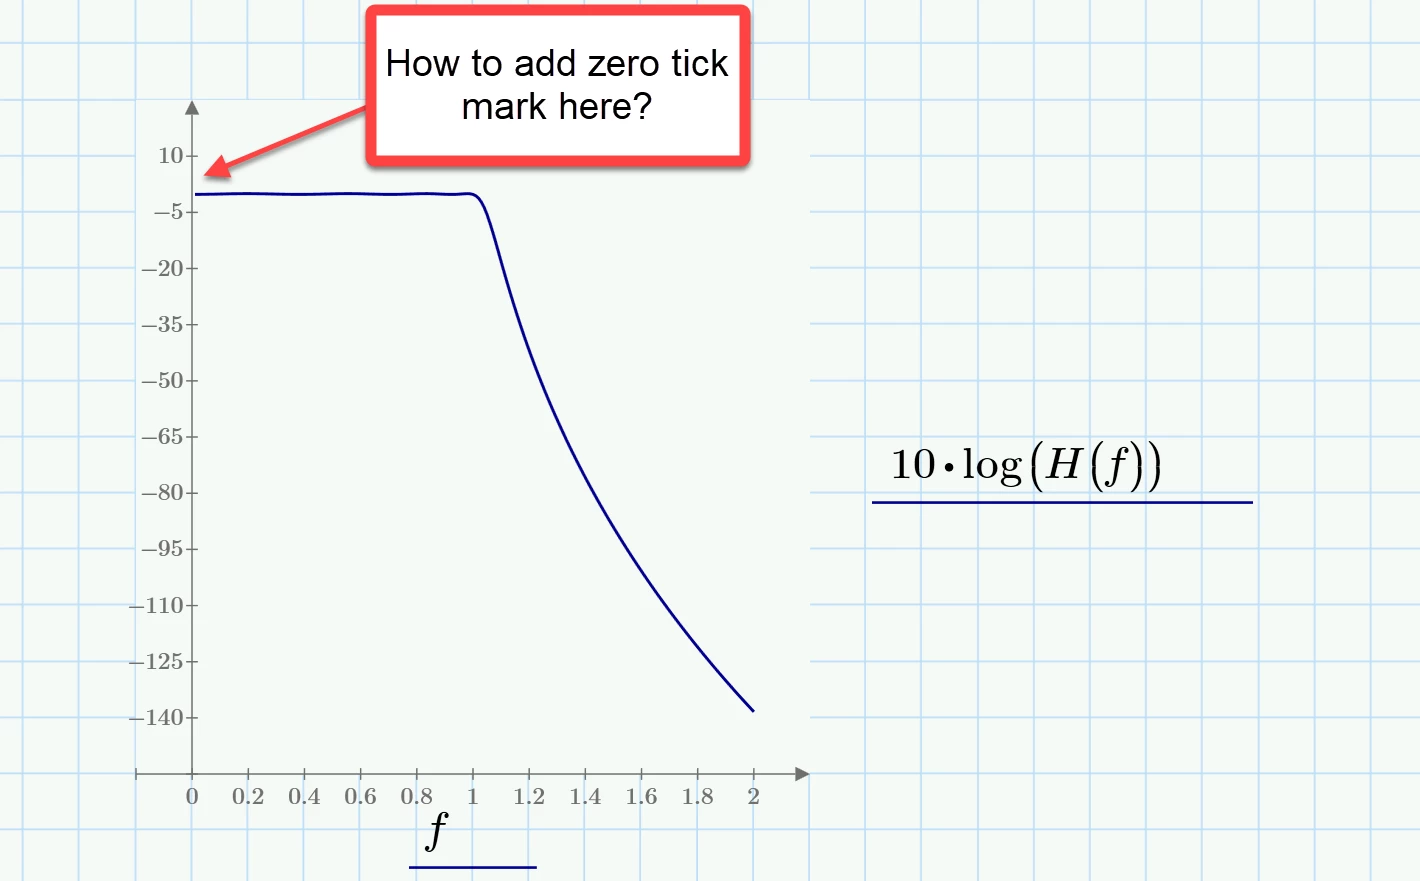
I can’t figure out how to adjust the scale of the y-axis. Is this possible? (see screen capture)

I can’t figure out how to adjust the scale of the y-axis. Is this possible? (see screen capture)
No account yet? Create an account
Enter your E-mail address. We'll send you an e-mail with instructions to reset your password.