plot results of linkeage analysis instead of just instantaneous results
- August 19, 2015
- 8 replies
- 4602 views
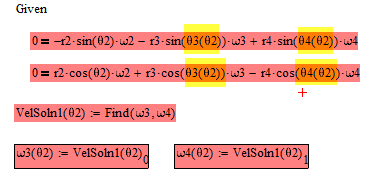
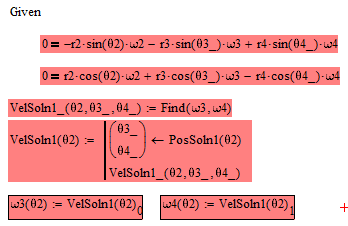
In my mathCAD sheet, I've solved this four bar linkeage for any user input of crank position, but what I'd like to do now is develop equations to describe the motion of the links (and particularly a point in question) through out the entire 360 degree range of my crank arm. This sheet uses scalar position equations and Given / Find solve blocks to solve for link arm angle, angular velocity, and angular acceleration based on the user input of crank angle, which in my sheet is θ2.
I would like to make θ2 a range variable, or a matrix of values from 0 - 360 degrees so I can output and then plot the motion of the point I'm looking for, but I'm stuck. The Given / Find block fails, and then obviously the rest of the sheet fails. If I'm approaching this incorrectly from a programming stand point, please let me know.