1-Visitor
November 19, 2013
Solved

Plotting a crystal in Mathcad

  • November 19, 2013
  • 5 replies
  • 3261 views

Hello guys,

I have a question about ploting a crystal in Mathcad. In general crystal is made by translation of unit cell in a periodical way along x,y,z for some increment a, b, c. The a, b and c determine the size of unit cell, while x, y and z can be at some angle: alpha, beta, gamma (see attached figure).

Lets say that crystal is rock salt (NaCl). Then Na and Cl atoms are positioned within unit cell in some regular manner. The plotting of one unit cell in a form of 3D plot in Mathcad is simple, but I am curious how to create a crystal of desired size? I guess it has to do something with vectors.

Thanks,

Goran
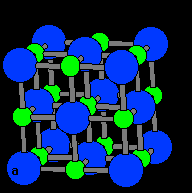
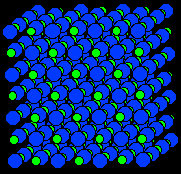
NaCl_unit+cell.bmpNaCl_3x3+unit+cell.bmp

NaCl unit cell NaCl crystal - 3x3 unit cells
Best answer by Werner_E

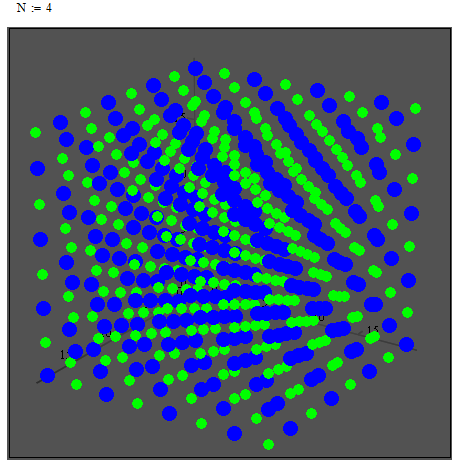
Maybe something like the attached could help.

You can control the direction of translation with the three vectors in the sheet.

NaCl_2.png

5 replies

Werner_E
25-Diamond I
November 19, 2013

The plotting of one unit cell in a form of 3D plot in Mathcad is simple,

Really? So lets see what you have done so far and attach your worksheet.

That way we also would see what Mathcad version the question is related to.

naz_or1-VisitorAuthor
1-Visitor
November 19, 2013

Hi,

Above I've just provided a general description of a problem. What follows is the Mathcad15 file with NaCl crystal as an example.

Thanks!

Werner_E
25-Diamond I
November 19, 2013

So you do not show the connections/bindings and you do not model the atoms as spheres. That way they won't scale and you would have to manually scale the size down with increasing numer of cells.

While it should be possible to write routines which create the necessary vectors (at least for the orthogonal case, I don't think that Mathcad is the right tool for this task.

BTW, what your sheet shows is not the full unit cell, right? At least not according to the pictures you added in your first post.