

Plotting contour of two functions of multiple variables
Hi
I have two functions, f1(x1,x2,x3,x4,x5) and f2(x1,x2,x3,x4,x5), which I'd like to plot with one function on each axis in a X-Y plot. The variables are limited to certain ranges, and I've been able to make scatter plots, by using nested for-statements of the variables (see fig. 1), and creating vectors of the results. This doesn't give the best result, since the use of discrete values for the variables is very obvious.
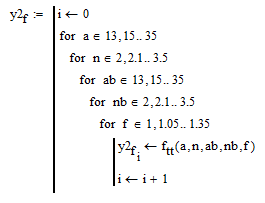
Fig. 1: Nested for-statments used to create vector
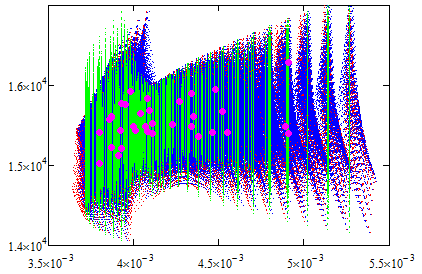
Fig. 2: Scatter plots of the two functions (for the green plot f1 is only dependent on two of the variables, making the discrete values use for calculation more obvious). The pink dots are the data points used to create the functions.
Is it possible to get the contour of the two functions with the given boundaries of the variables? I would be very nice, if I was able to just show the region of all possible values.
Sorry for my bad english, but I hope I've made myself understood.
Thanks in advance.