1-Visitor
May 23, 2013
Solved
problem with 3D function plotting
- May 23, 2013
- 3 replies
- 2021 views
Hi everyone!
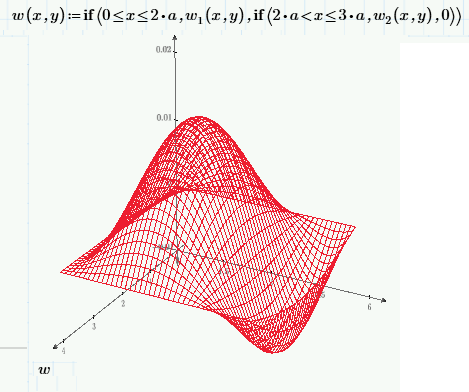
I have a problem with 3D plotting of function and I have no idea why it occurs!
My function contains two of them: w1(x,y) and w2(x,y) and in fact w2(x,y) is 0.
w1(x,y) is in range of 0<x<2a
w2(x,y) is in range of 2a<x<3a
2D Contour plot looks quite good but mathcad says that 3D plot cannot be executed because it doesn't evaluate to real number.
What is curious, the program doesn't have problems with 3D plotting of neither w1(x,y) nor w2(x,y).
I've attached the file.
Any ideas?
I would appreciate any solution.
regards
koffaleq