
Solved
Problem with polts
Hi
I have one small problem with Mathcad plots. Mathcad plots my function only in part of it insted of filling whole XY plane. I attach my mathcad file as an example. What can I do for the plot to be bigger?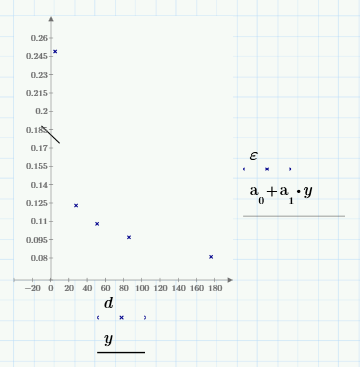

Hi
I have one small problem with Mathcad plots. Mathcad plots my function only in part of it insted of filling whole XY plane. I attach my mathcad file as an example. What can I do for the plot to be bigger?
From your graph (y only goes from -10 to 10) I'd guess you didn't define the range you wanted for y. If you don't define a range, Mathcad plots from -10 to 10.
define y to be a range variable
y:=0..180
and your line will extend to that span.
No account yet? Create an account
Enter your E-mail address. We'll send you an e-mail with instructions to reset your password.