

quest for 3D plot capabilities
I wish to plot 32 or more long narrow cylindric shapes in a 3D plot in a way that they can be independently described with equations. This would allow me to construct some interesting 3D projections of a hypercube and other interesting shapes.
I was able to do this by directly specifying 32 comma separated functions in the 3D plot placeholder, but to say the least, this is much too awkward.
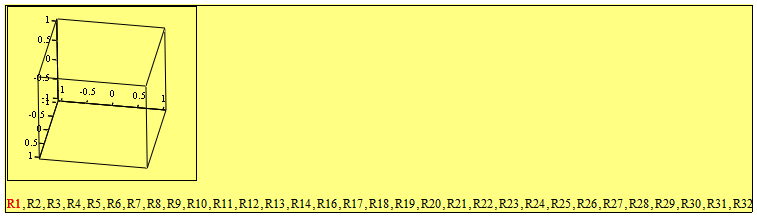
(This plot is a dummy with empty function place holders just to show the problem. BTW docs say 16 functions allowed, but 32 functions will work)
Is there a clean way to do this with any of mathcad graphic capabilities?
If so, what is the simplest way? By the way, I think the 3D plot might have the capability if I only new how to input it. Here are the areas I thought might be possible, any feedback would be welcomed:
1) Is there any way to assign a comma delimited list of functions or vectors to variable so that the single variable placed in the 3D plot placeholder would have the same effect as directly specifying the comma delimited list in the 3D plot placeholder?
or
2) The Polyhedron function mysteriously causes 3D plot to display a complicated figure of many bounded planes , so clearly there is the capability to display many bounded shapes without specifying comma separated functions in the 3D plot placeholder. Does this imply some way I can pass an arbitrary set of shapes in the same way...if I only knew how?
or
3) Do any of the vector, surface, or function formats easily enable the combination of a number of independent, separated shapes in a single specification that can then be used in 3D plot?
or
4) Is there any other way with 3D plot or any other graphic way that is easily available to me?