1-Visitor
October 20, 2020
Solved

There are too many ranges variables

  • October 20, 2020
  • 3 replies
  • 5946 views

Hello everyone,

 In scenario 4, I got everything correctly. However, when I tried to graph the plot. There were an issue with "too many range variables". 


I read some posts that recommend to change the number of points. However, it was invisible to click on. Would you guys please help me with this?


Thank you so much

Best answer by Werner_E

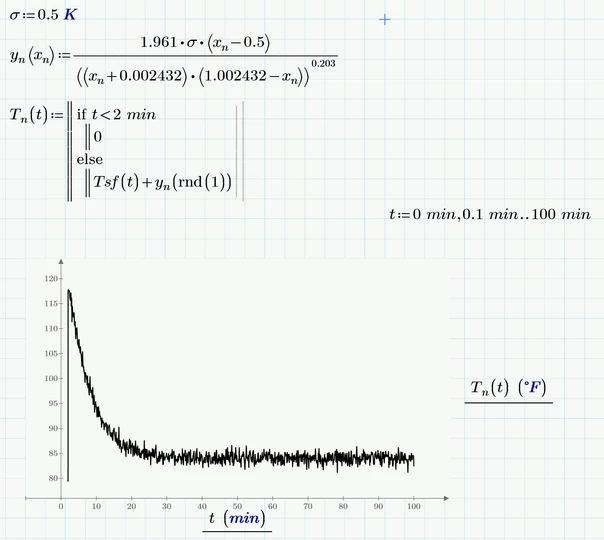
You still have the wrong definition of sigma! You compare 0.5*1 with 0.5K and the result is zero (because they are not equal) and this zero is assigned sigma. Your sigma is zero! Give it a try. Furthermore in the definition of y.n you used sigma as if it were a function.

And the way you defined and used x.n your "noisy" signal would have used the very same random number for every time - not very noisy 😉

Here is a way to do it. Do you really mean T.n to be 0 (zero what - K, °F, Delta°F,..?) for times smaller than 2 minutes? You may replace the 0 by NaN (which suppresses plotting) or by Tsf(2 min).

Werner_E_0-1603207314402.png


3 replies

24-Ruby IV
October 20, 2020

ttt.png

1-Visitor
October 20, 2020

Do you have any recommendation for this? 😞 The Tsf was calculated in scenario 3. I'm not sure why the Tn(ti) doesn't work

24-Ruby III
October 20, 2020

failure.png

1-Visitor
October 20, 2020

Hello Martin,


Sigma unit is K so yn is also K. I have added the unit to K and Tn(i) still doesnt work. It probably because of my the function or something.


thank you so much for the feedback

24-Ruby III
October 20, 2020

Hi,

you must define yn as function !!!

25-Diamond I
October 20, 2020

Looking for something like this?


Werner_E_0-1603204814189.png


1-Visitor
October 20, 2020

Hello,

it looks really good. But the Tn is T noise so it would start at 2 and the time interval is ti = 2,3...99. I have some new updated here.


You are life saver for sure 🙂


Thank you so much.

Werner_E25-Diamond IAnswer
25-Diamond I
October 20, 2020

You still have the wrong definition of sigma! You compare 0.5*1 with 0.5K and the result is zero (because they are not equal) and this zero is assigned sigma. Your sigma is zero! Give it a try. Furthermore in the definition of y.n you used sigma as if it were a function.

And the way you defined and used x.n your "noisy" signal would have used the very same random number for every time - not very noisy 😉

Here is a way to do it. Do you really mean T.n to be 0 (zero what - K, °F, Delta°F,..?) for times smaller than 2 minutes? You may replace the 0 by NaN (which suppresses plotting) or by Tsf(2 min).

Werner_E_0-1603207314402.png