1-Visitor
March 30, 2013
Solved

To Solve 3 variables in Mathcad Program

  • March 30, 2013
  • 4 replies
  • 10620 views

Dear All Experts,

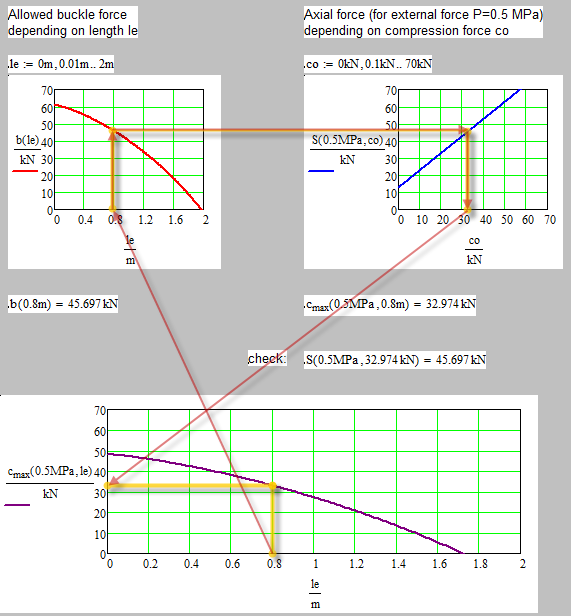
at the moment i have a situation on assessing a cylidrical pipe compressive buckling study with few variables which are

1) external pressure

2) compressive force

3) pipe length.

i have manage to obtain a sets of effective axial force by considering 1) and 2) variables in an equation. End up with a sets of tables whereby values in row is due to external pressure variation and column is due to compressive force variation.

later i need to check the allowable buckling force which dependet on 3rd variables which is the length 3)

Finally i need to compare both allowable and calculated effective axial force. How can i do it in a mathcad without doing it manually.

in attached spreadsheet i did put some remark for better understanding.

Appreciate your help and at the moment please ignore the theory on concept of the study in the spreadsheet.

Thank you

-Akmal-

Best answer by Werner_E

Maybe this helps to understand better whats going on:

buckle6.png

4 replies

24-Ruby IV
March 30, 2013

1. Density of sea water (IAPWS formulation) - http://twt.mpei.ru/MCS/Worksheets/WSP/SeaWater.xmcd

25-Diamond I
March 30, 2013

If I understand correct what your intend is the following small function should do the job.yesno.png

25-Diamond I
March 30, 2013

I have added the construction of a table or for all values in the attached

1-Visitor
March 30, 2013

Dear Werner,

wow your spreadsheet really a sophisticated one which i'm not sure how to read it anyway really thanx.

just to clarify with you.....

1) what is for example b=0 represent? and the statement from column 0, row 1 to column 9 row 10 which from my values does it represents?

2) if say i want to plot a trend graph between the compressive force vs length that start to say "yes" (with a selected external pressure say 0.5MPa) can i still do that?

Thank you again

Regards

-Akmal-

25-Diamond I
March 30, 2013

wow your spreadsheet really a sophisticated one which i'm not sure how to read it anyway really thanx.

I think the tricky parts in the makeTable routine are mainly to get some kind of "header/separator" text.

As I use stack to construct the matrix row by row I need a row to start with (thats the dummy one) which I have to get rid of at the end (submatrix). An alternative would have been an if statement before the stack command

1) what is for example b=0 represent? and the statement from column 0, row 1 to column 9 row 10 which from my values does it represents?

If you want to keep that table you will have to provide a text which makes more sense, here.

These lines are meant to separate the 10 different 10x10 matrices. b=0 means the matrix you get when you compare all values in the matrix S (S_a1) with the first value in the vector b (bl1) - the on with index 0.

I didn't know if making that table would make any sense at all,but at least I guessed, that you wanted to compare the whole matrix S_a1 (not only the first two columns you did manually) with every value in matrix bl1, making a total of 1000 yes/no's. Hope this was right. There are other methods to present those values, nested vectors, matrices which show the comparison of a single column of S_a1 to the vector bl1, etc.

2) if say i want to plot a trend graph between the compressive force vs length that start to say "yes" (with a selected external pressure say 0.5MPa) can i still do that?

Not sure what you mean. Lets put it down to my mathematical level. The compressive force you are speaking of are the 100 values in matrix S_a1? These values should be on the ordinate axis? Which of them? I guess only a single row, as this are the values related to a specific pressure (depending on the values of P.r.) What should be on the abscissa? The values of Le which are used to calculate bl1?

What about that pressure 0.5 MPa you mentioned. Its not a value in your vector P.r, so the values for this pressure are not represented in the matrix S_a1. Are you after some kind of interpolation?

Anyway, can you be more precise and maybe give an example. We are talking about a 2-dimensional diagram, aren't we?

1-Visitor
April 1, 2013

kinldy please tell me that whee i can watch pro e tutorial's any good and free website tell me please sir i am doing job as a pro engineer in mechanical company

25-Diamond I
April 1, 2013

AGAIN - PLEASE POST IN THE RIGHT SECTION OF THIS FORUM!

You won't find pro-e help here in the Mathcad section.

As Vladimir already told you:

Please ask your question in Creo (earlier Pro/ENGINEER) community, here:

http://communities.ptc.com/community/post!input.jspa?containerType=14&container=2023

http://communities.ptc.com/community/creo