1-Visitor
February 11, 2017
Solved
Trouble Plotting Functions
- February 11, 2017
- 1 reply
- 1509 views
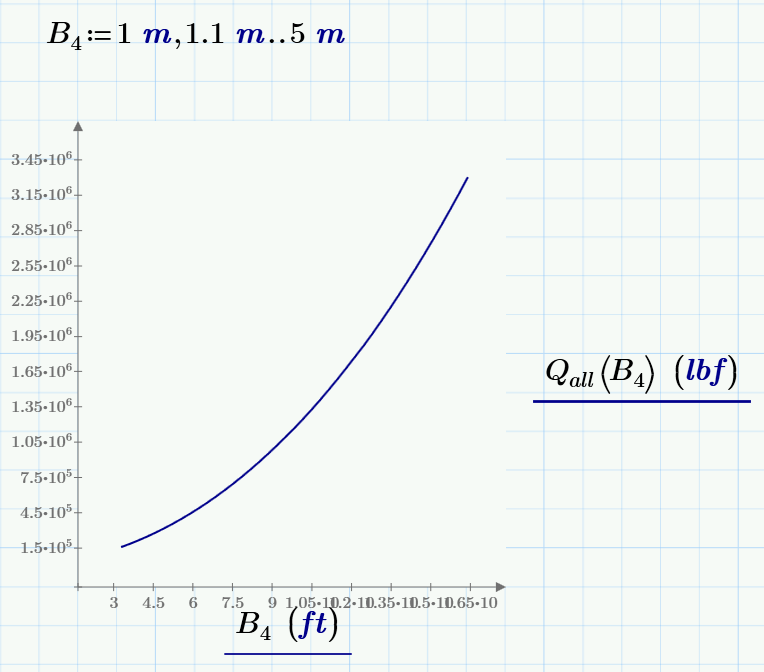
When I try to plot a user defined function on the y-axis vs. the independent variable on the x-axis, the independent variable is marked as undefined, and the plot fails; However, when I switch the positions of the function and the independent variable, such that the independent variable is on the y-axis, the plot works perfectly. Why is this the case? I need to plot the independent variable on the x-axis for the assignment I am working on. I have attached what I have so far. The plot is at the very end. Any information will help! Thanks!: