Question
Using a Range Variable to Plot Multiple Lines
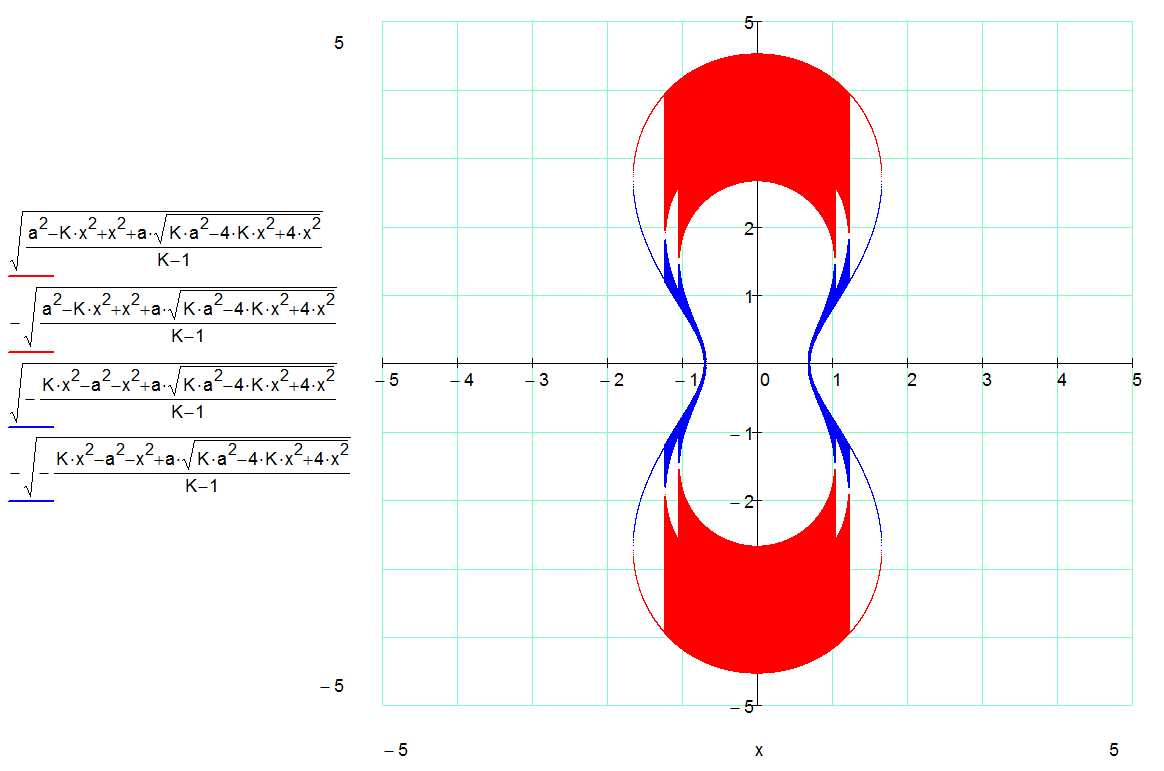
I'm plotting an equation using a range variable to sweep x. I'm also using a range variable to sweep another variable in the equation (3 values). I expect to get 3 different lines on the plot, which I do. However, there is some additional solid "fill" in the plot that I don't want. I just want the 3 lines. Ideas on how to get rid of the fill?