1-Visitor
February 19, 2014
Solved

Why these two plots are different?

  • February 19, 2014
  • 10 replies
  • 5459 views

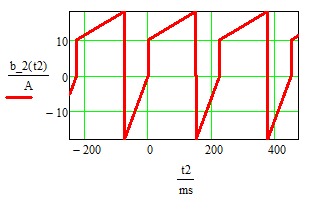
I want to get the period waveform b(t) but when i plot it i find that the plot has a lot of spikes.

the x definition domain is[ 0, f^-1 ) of original function y(t).

Please see the detailed attachment in MathCad15 F000.

Thanks~

Best answer by Werner_E

In the definition of y(t), on te first line change t greater than or equal to 0 to t greater than 0.

No, this would result in spikes down to zero for most integer multiples of f^-1. (e.g. b(8*f^-1)=0! The problem with b(10*f^-1) is due to numeric inaccuracies combined with the way Pirates tried to make his function periodic using that sum. Basically he is summing up y(10*f^-1 - n*f^-1) and all n but n=10 (yields 13A) should yield 0. Because of numerical inaccuracies 10*f^-1 - 9*f^-1 does not evaluate to f^-1 but to a value very slightly smaller and so y(of this value) is not zero but close to 13. See attached file.

triangle+wave.png

Thats nice! And in case Pirates really need it more generic as his variables y1..y4 and D suggest, attached is a sheet which shows some ways to make any function defined in [0; f^-1) a periodic one.

19.02.png

10 replies

25-Diamond I
February 19, 2014

The plots look different because you used Mathcads quickplot feature with different x-ranges. Mathcad will plot using a fix number of points for the whole range, no mattter how long that range may be. That means that for your plot 3 less points are used for the visibile part of your curve and obviously the x-value which results in that spike is not amongst the plotted values in your plot 3.

You have more control if you use a range variable for x, lets say x:=9*f^-1,9*f^-1+2*f^-1/100 .. 11*f^-1. Play around with the number I set to 100, it gives you the numer of point used for the plot.

What is the reason for the definition of your function b(x)? If you just tried to make your function periodic, there are more efficient ways to do.

1-Visitor
February 20, 2014

Thank you for your answers.

After I read all the posts,I think I kown why the plot has spikes.

What is the reason for the definition of your function b(x)? If you just tried to make your function periodic, there are more efficient ways to do.

You are right.I just want to get a periodic function to show a real current waveform in panorama, althought the RMS and AVG value can be calculated from y(t) which is a non-periodic function. Your ways to make periodic function are nice. Thank you.

19-Tanzanite
February 19, 2014

In the definition of y(t), on te first line change t greater than or equal to 0 to t greater than 0.

This function will generate a traingle wave of period T and amplitude A:

triangle+wave.png

Werner_E25-Diamond IAnswer
25-Diamond I
February 19, 2014

In the definition of y(t), on te first line change t greater than or equal to 0 to t greater than 0.

No, this would result in spikes down to zero for most integer multiples of f^-1. (e.g. b(8*f^-1)=0! The problem with b(10*f^-1) is due to numeric inaccuracies combined with the way Pirates tried to make his function periodic using that sum. Basically he is summing up y(10*f^-1 - n*f^-1) and all n but n=10 (yields 13A) should yield 0. Because of numerical inaccuracies 10*f^-1 - 9*f^-1 does not evaluate to f^-1 but to a value very slightly smaller and so y(of this value) is not zero but close to 13. See attached file.

triangle+wave.png

Thats nice! And in case Pirates really need it more generic as his variables y1..y4 and D suggest, attached is a sheet which shows some ways to make any function defined in [0; f^-1) a periodic one.

19.02.png

19-Tanzanite
February 19, 2014

In the definition of y(t), on te first line change t greater than or equal to 0 to t greater than 0.

No, this would result in spikes down to zero for most integer multiples of f^-1. (e.g. b(8*f^-1)=0!

Yes, you are right. It works forthe plots he has, but it wil not always work.

Thats nice!

I wish I could claim I thought of it, but it's from Tom Gutman

attached is a sheet which shows some ways to make any function defined in [0; f^-1) a periodic one.

That's very useful. I just added that to my collection.