15-Moonstone
October 29, 2022
Solved

workaround for mathcad 15 plotting bug

  • October 29, 2022
  • 1 reply
  • 4661 views

hi,


i seem to have run into a bug with mathcad 15 plotting. i'm sure there is a way around it. however, i don't know how to do it. i put the question in the file. it's near the bottom of the file. i think there needs to be an if statement that checks to see if both elements of the matrix are negative. if so, make them positive. the matrix with the problem is called 'mode1'.


sorry, the file is kind of a mess right now. i want to clean it up and post it as an update to a very old thread on here. i was able to take something someone posted 'pre mathcad 15' and get it working with mathcad 15. however, i wanted to get this plotting glitch fixed before i did that.


i also found that a number of the eigenvalue and eigenvector functions have bugs as well. luckily, the ones i used in this file seem to work good.


thanks,


anthony

Best answer by Werner_E

On contrary to the Eigenvalues, Eigenvectors are not unique. Every multiple of an Eigenvector is again an Eigenvector corresponding to the same Eigenvalue. This said you can always multiply each Eigenvector with the sign of its first component. This will always make the first component positive.

Werner_E_1-1667010933034.png


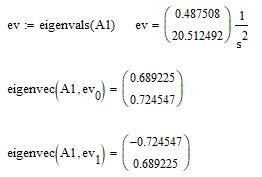
The order of the Eigenvectors given by "eigenvecs" may not correspond to the order of Eigenvalues returned by "eigenvals" (actually I am not sure about that). To be on  the save side you can use "eigenvec" (without the trailing "s") to give you an Eigenvector for a specific Eigenvalue.

Werner_E_0-1667010672307.png

I am not sure why the signs of the components of the first Eigenvector is different from the one given by "eigenvals", but of course both are correct and valid.


According the vector field plot you are using: I am not sure what you think its showing?? You may look up the explanation of the vector field plot in the help to see what kind of data structures it expects as its input.

Your vector is interpreted a a vector of complex numbers, where the real part represents the horizontal and the imaginary part represents the vertical direction of the arrow. The starting points of the arrows are always the row and column numbers.

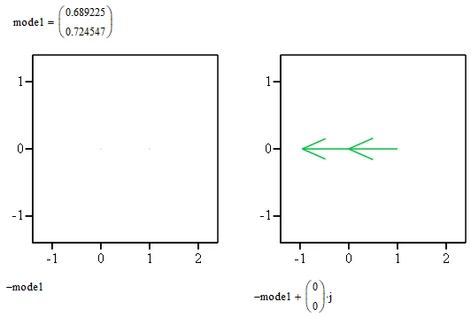
For some reason (I guess its a bug) this does not work if both numbers are negative. Strange enough it helps to simply add an "imaginary null vector".

Werner_E_2-1667012561468.png

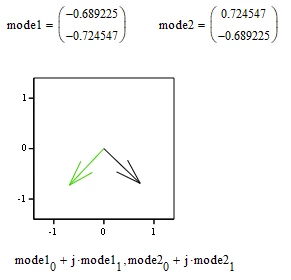
If your goal was to plot the two Eigenvectors, both starting at (0;0), you could do it that way:

Werner_E_3-1667012860486.png


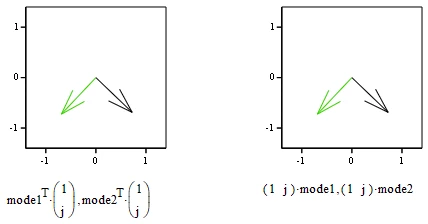
EDIT: Could be a bit easier achieved by one of the following ways

Werner_E_0-1667013643596.png


1 reply

Werner_E25-Diamond IAnswer
25-Diamond I
October 29, 2022

On contrary to the Eigenvalues, Eigenvectors are not unique. Every multiple of an Eigenvector is again an Eigenvector corresponding to the same Eigenvalue. This said you can always multiply each Eigenvector with the sign of its first component. This will always make the first component positive.

Werner_E_1-1667010933034.png


The order of the Eigenvectors given by "eigenvecs" may not correspond to the order of Eigenvalues returned by "eigenvals" (actually I am not sure about that). To be on  the save side you can use "eigenvec" (without the trailing "s") to give you an Eigenvector for a specific Eigenvalue.

Werner_E_0-1667010672307.png

I am not sure why the signs of the components of the first Eigenvector is different from the one given by "eigenvals", but of course both are correct and valid.


According the vector field plot you are using: I am not sure what you think its showing?? You may look up the explanation of the vector field plot in the help to see what kind of data structures it expects as its input.

Your vector is interpreted a a vector of complex numbers, where the real part represents the horizontal and the imaginary part represents the vertical direction of the arrow. The starting points of the arrows are always the row and column numbers.

For some reason (I guess its a bug) this does not work if both numbers are negative. Strange enough it helps to simply add an "imaginary null vector".

Werner_E_2-1667012561468.png

If your goal was to plot the two Eigenvectors, both starting at (0;0), you could do it that way:

Werner_E_3-1667012860486.png


EDIT: Could be a bit easier achieved by one of the following ways

Werner_E_0-1667013643596.png


15-Moonstone
October 29, 2022

hi werner,


unfortunately eigenvec and the other function i think it's genval genvec. they all randomly fail depending upon inputs. the only function that worked for all the test cases i ran was eigenvecs eigenvals. there just seems to be some sort of plotting bug if both entries are negative. the plots duplicate something i'm testing in fea software. so i know what they are showing. i already got the sorting worked out based on a decades old post. i just tweaked a few things to get it working with v15. i'll try to apply what you are saying about flipping the signs. i'm still confused on how to do that. it will plot if both are positive or one is positive and one is negative. it won't plot if both are negative. it would be fine to always make it positive. the only problem is i can't just do an absolute value because sometimes one is supposed to be negative. so that is where i was thinking an if statement would be needed.

25-Diamond I
October 29, 2022

I edited my first reply in the meantime and attached a screenshot showing what I meant by multiplying by the sign of the first vector component.

I also added a workaround which makes your plot work in case of two negative numbers (adding the imaginary null vector).

You may ignore my last remarks about plotting the vectors if what your plots show is already exactly what you are looking for.


Can you post an example where "eigenval" returns a wrong result whereas "eigenvals" doesn't?