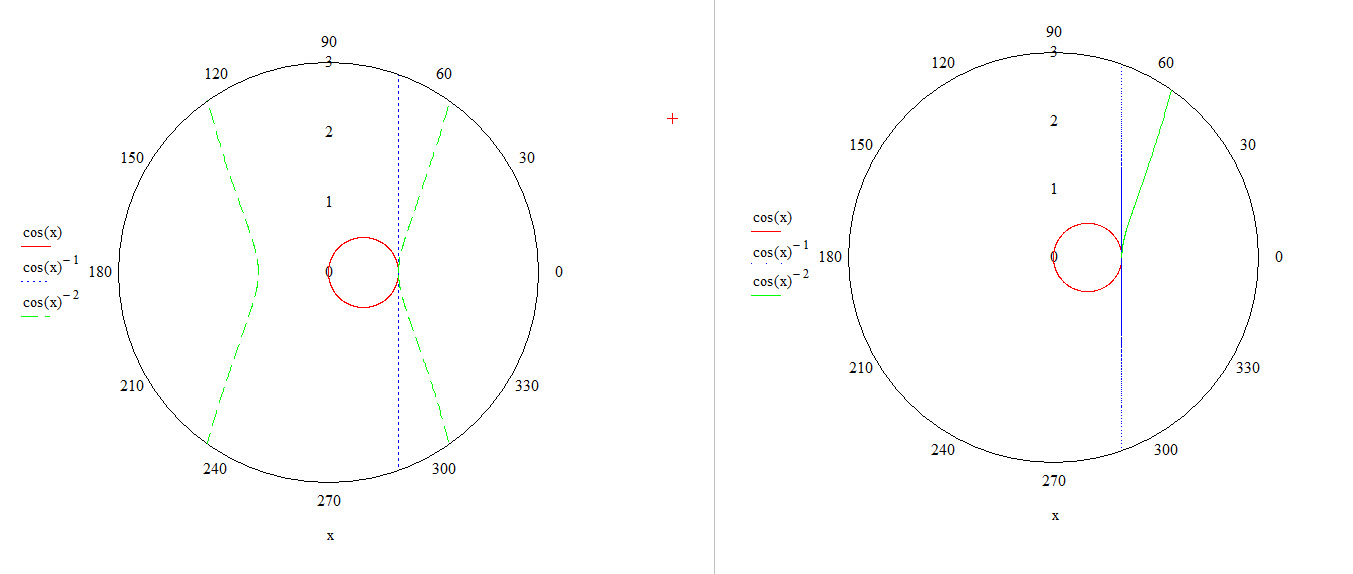
MathCAD 15.0: Polar plot display abnormally when setting the line trace type to full line or dashed line.
Create 2 polar plot for the functions cos(x), cos(x)^(-1) and cos(x)^(-2). Set the line trace style to full line, the result plot for the cos(x)^(-2) is invalid, other line trace valid.