1-Visitor
August 10, 2016
Question

how can i interpolate x values and y values on the chart

  • August 10, 2016
  • 1 reply
  • 1814 views

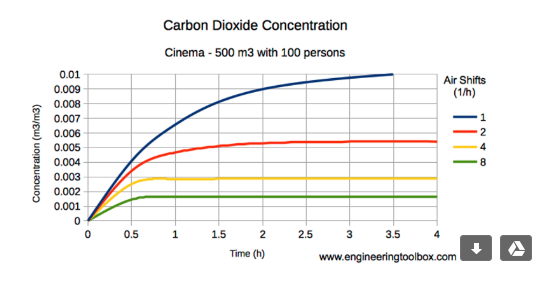
for example i have shown the figure

How can i plot such graphs

i have calculated all the parameters required for this

Please and kindly help

1 reply

14-Alexandrite
August 10, 2016

Hi Sruchan,

You need to use the TimeSeries Chart. In order to use it you need  a service that returns an Infotable that has at least one NUMBER and one TIMEDATE fields.

You may want to refer to the Tutorial: Advanced Chart Widgets Tutorial - YouTube

Cheers

Ewerton

sred1-VisitorAuthor
1-Visitor
August 15, 2016

How to make plotting as curve as that in the above chart

what is the best chart to use to represent as the above chart