11-Garnet
December 18, 2014
Solved

How to plot a 3D vector as an array: attempts and problems

  • December 18, 2014
  • 1 reply
  • 7267 views

I am using MC v.11.2, and I attempted to plot a column vector (3x1), as one would do in Vector algebra.

I saw in the forum for help, and I found the following method:

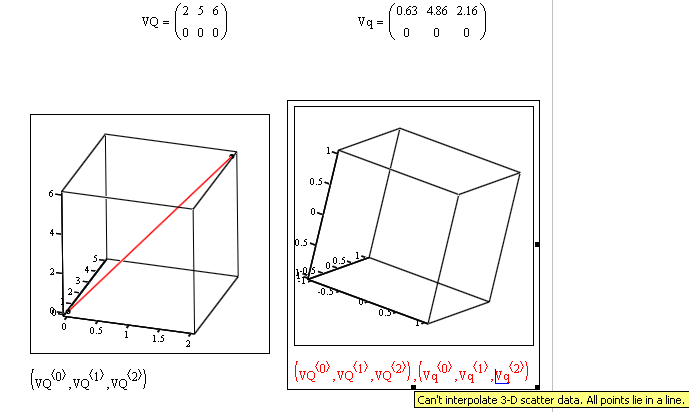
1. Take the vector and turn it in the first row of a matrix of dimension 2x3

2. Place in the second row of the matrix the coordinates of the origin of the vector (in my case zero)

3. Create a 3D Scatter (or Field) Plot and write the three columns of the above matrix.

I tried in MC 15, and it works for more than one vector. I re-tried several times the same with v.11.2 and the following error is shown (see figure).

I timidly ask:

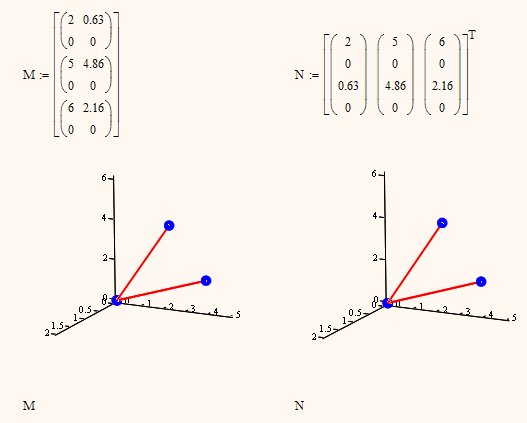
a) Is it possible to plot more than one vector in MC v.11.2 with the above method?

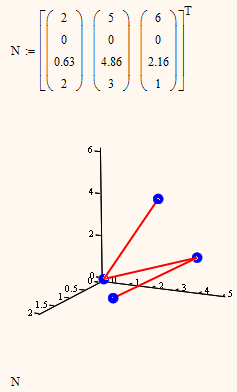
b) If it is possibile with the method above, where is my error and how many vectors can one plot (I would need at least 3 or 4).

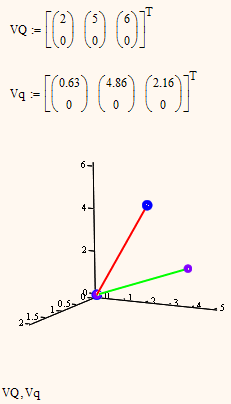
c) If it is impossible, are there some other effective methods able to do it with MC v11.2?

Thanks for any feedback.

BTW, this is one field where MC lies behind as compare to competitors, where there is a specific command to plot vectors without any additional trouble.

Mathcad_3D_Vector_Error.png

Best answer by Werner_E

I tried in MC 15, and it works for more than one vector. I re-tried several times the same with v.11.2 and the following error is shown (see figure).

I get the very same error in Mathcad 15. The reason is that unless you change that a 3D plot defaults to a surface plot. If you set the plot type to "Data Points" / "Scatter Plot" for BOTH plots, it works OK. There is an age old bug in the 3D plot component so simply chosing scatter/data points does not help. You have to change the plot type to vector field first and then to scatter.

I am not sure about MC 11 but it works that way in MC15.

Instead of typing the various column selectors in the plot placeholder you may as well plot a data type like the following:

1.png

You may also plot one of the following matrices which creates just one single plot and not multiple ones, but it looks better than is is. Mathcad will connect ALL four points which just isn't seen in this example because oth vectors include the origin. So the cennection of the last point of the first with the first point of the second vector happens to be the second vector itself and this second vector is draw twice that way. Change the zero coordinates of the second vector and you will see.

In a 2D plot we would thrown in NaN's to stop Mathcad from connecting points, but unfortunately the 3D plot component in Mathcad 15 and below does not support NaNs and will throw an error.

2.png

I add the MC15 file saved in MC11 format - maybe its of help.

3.png

1 reply

Werner_E25-Diamond IAnswer
25-Diamond I
December 18, 2014

I tried in MC 15, and it works for more than one vector. I re-tried several times the same with v.11.2 and the following error is shown (see figure).

I get the very same error in Mathcad 15. The reason is that unless you change that a 3D plot defaults to a surface plot. If you set the plot type to "Data Points" / "Scatter Plot" for BOTH plots, it works OK. There is an age old bug in the 3D plot component so simply chosing scatter/data points does not help. You have to change the plot type to vector field first and then to scatter.

I am not sure about MC 11 but it works that way in MC15.

Instead of typing the various column selectors in the plot placeholder you may as well plot a data type like the following:

1.png

You may also plot one of the following matrices which creates just one single plot and not multiple ones, but it looks better than is is. Mathcad will connect ALL four points which just isn't seen in this example because oth vectors include the origin. So the cennection of the last point of the first with the first point of the second vector happens to be the second vector itself and this second vector is draw twice that way. Change the zero coordinates of the second vector and you will see.

In a 2D plot we would thrown in NaN's to stop Mathcad from connecting points, but unfortunately the 3D plot component in Mathcad 15 and below does not support NaNs and will throw an error.

2.png

I add the MC15 file saved in MC11 format - maybe its of help.

3.png

19-Tanzanite
December 19, 2014

If you want a really OTT worksheet showing how to plot vectors in 3D plots, here's something Stuart cooked up a while ago

11-Garnet
December 19, 2014

Dear Richard,

thanks to you too. The attached file shows very interesting plots, that I never thought were possible. Yet to understand how all that works, need a bit (more) of time, given my limited knowledge in MC. I guess the Stuart's file gives a lot more than just turning column 1x3 vectors into a cartesian 3D plot. But as an example it is challenging and interesting.