
Solved
Pie Chart to Donut Chart and add boundary to the bar chart
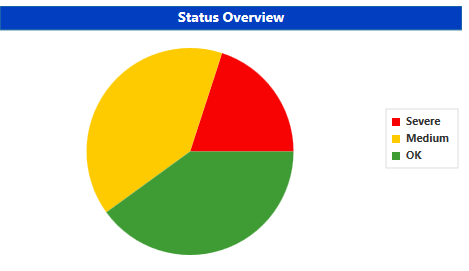
Can this pie chart be possibly changed to a kind of donut chart, by Thingworx composer?
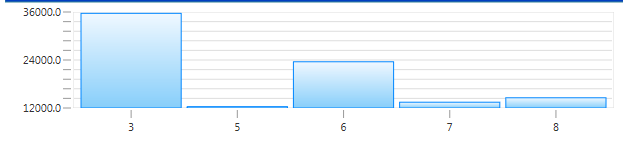
I also want to draw a upper boundary in this bar chart, how? Like draw a line in 30000.0.

Can this pie chart be possibly changed to a kind of donut chart, by Thingworx composer?
I also want to draw a upper boundary in this bar chart, how? Like draw a line in 30000.0.
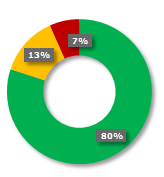
Here is a D3 Pie Chart Widget that has a donut feature via setting the inner radius. Note that this widget is provided as an example and is not officially supported; it also may conflict with other widget extensions that use the D3 library.
No account yet? Create an account
Enter your E-mail address. We'll send you an e-mail with instructions to reset your password.