

Question
Creating Map Mashup with 100 points
Hello,
I am trying to create a openmap mashup that shows multiple points (100) on it with specific information as you click on each point. I am new to the Thingworx software but I was able to plot many different things using bar graphs and now I am having trouble mapping coordinates. I take the steps below to upload a csv file using parsley and create a mashup but when it comes to mapping the separate points the map is blank (see attachments).
- Create a CSV with the correct Longitude and Latitude formatting. I used the Location formatting that is specified on the PTC website (http://support.ptc.com/cs/help/thingworx_hc/thingworx_7.0_hc/index.jspx?id=ThingProperties&action=show). On this site it shows the Location format should be Location = [longitude, latitude]. While on the Mashup it puts the location formatting as Location = [latitude, longitude] I tried uploading the data both ways and also with and without brackets.
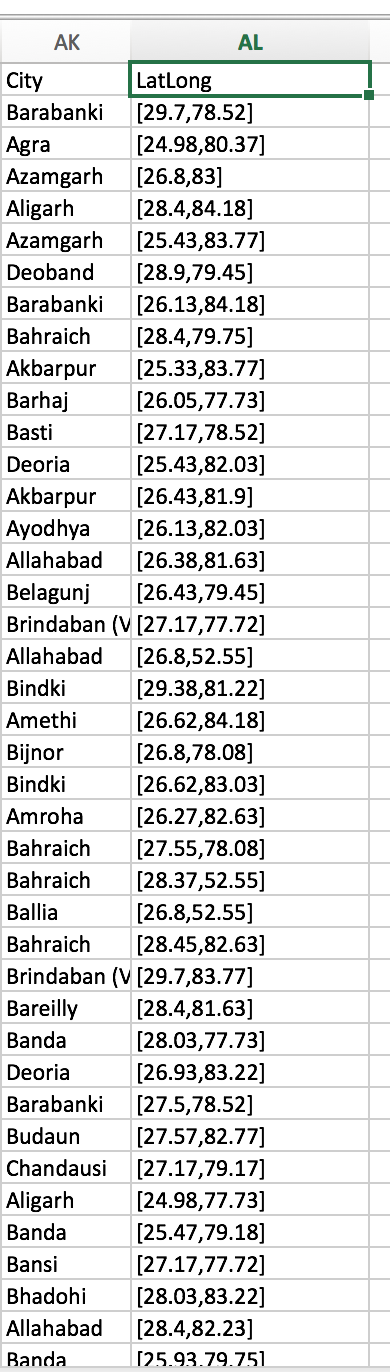
- I upload the CSV using Parsley and the data is shown is services.
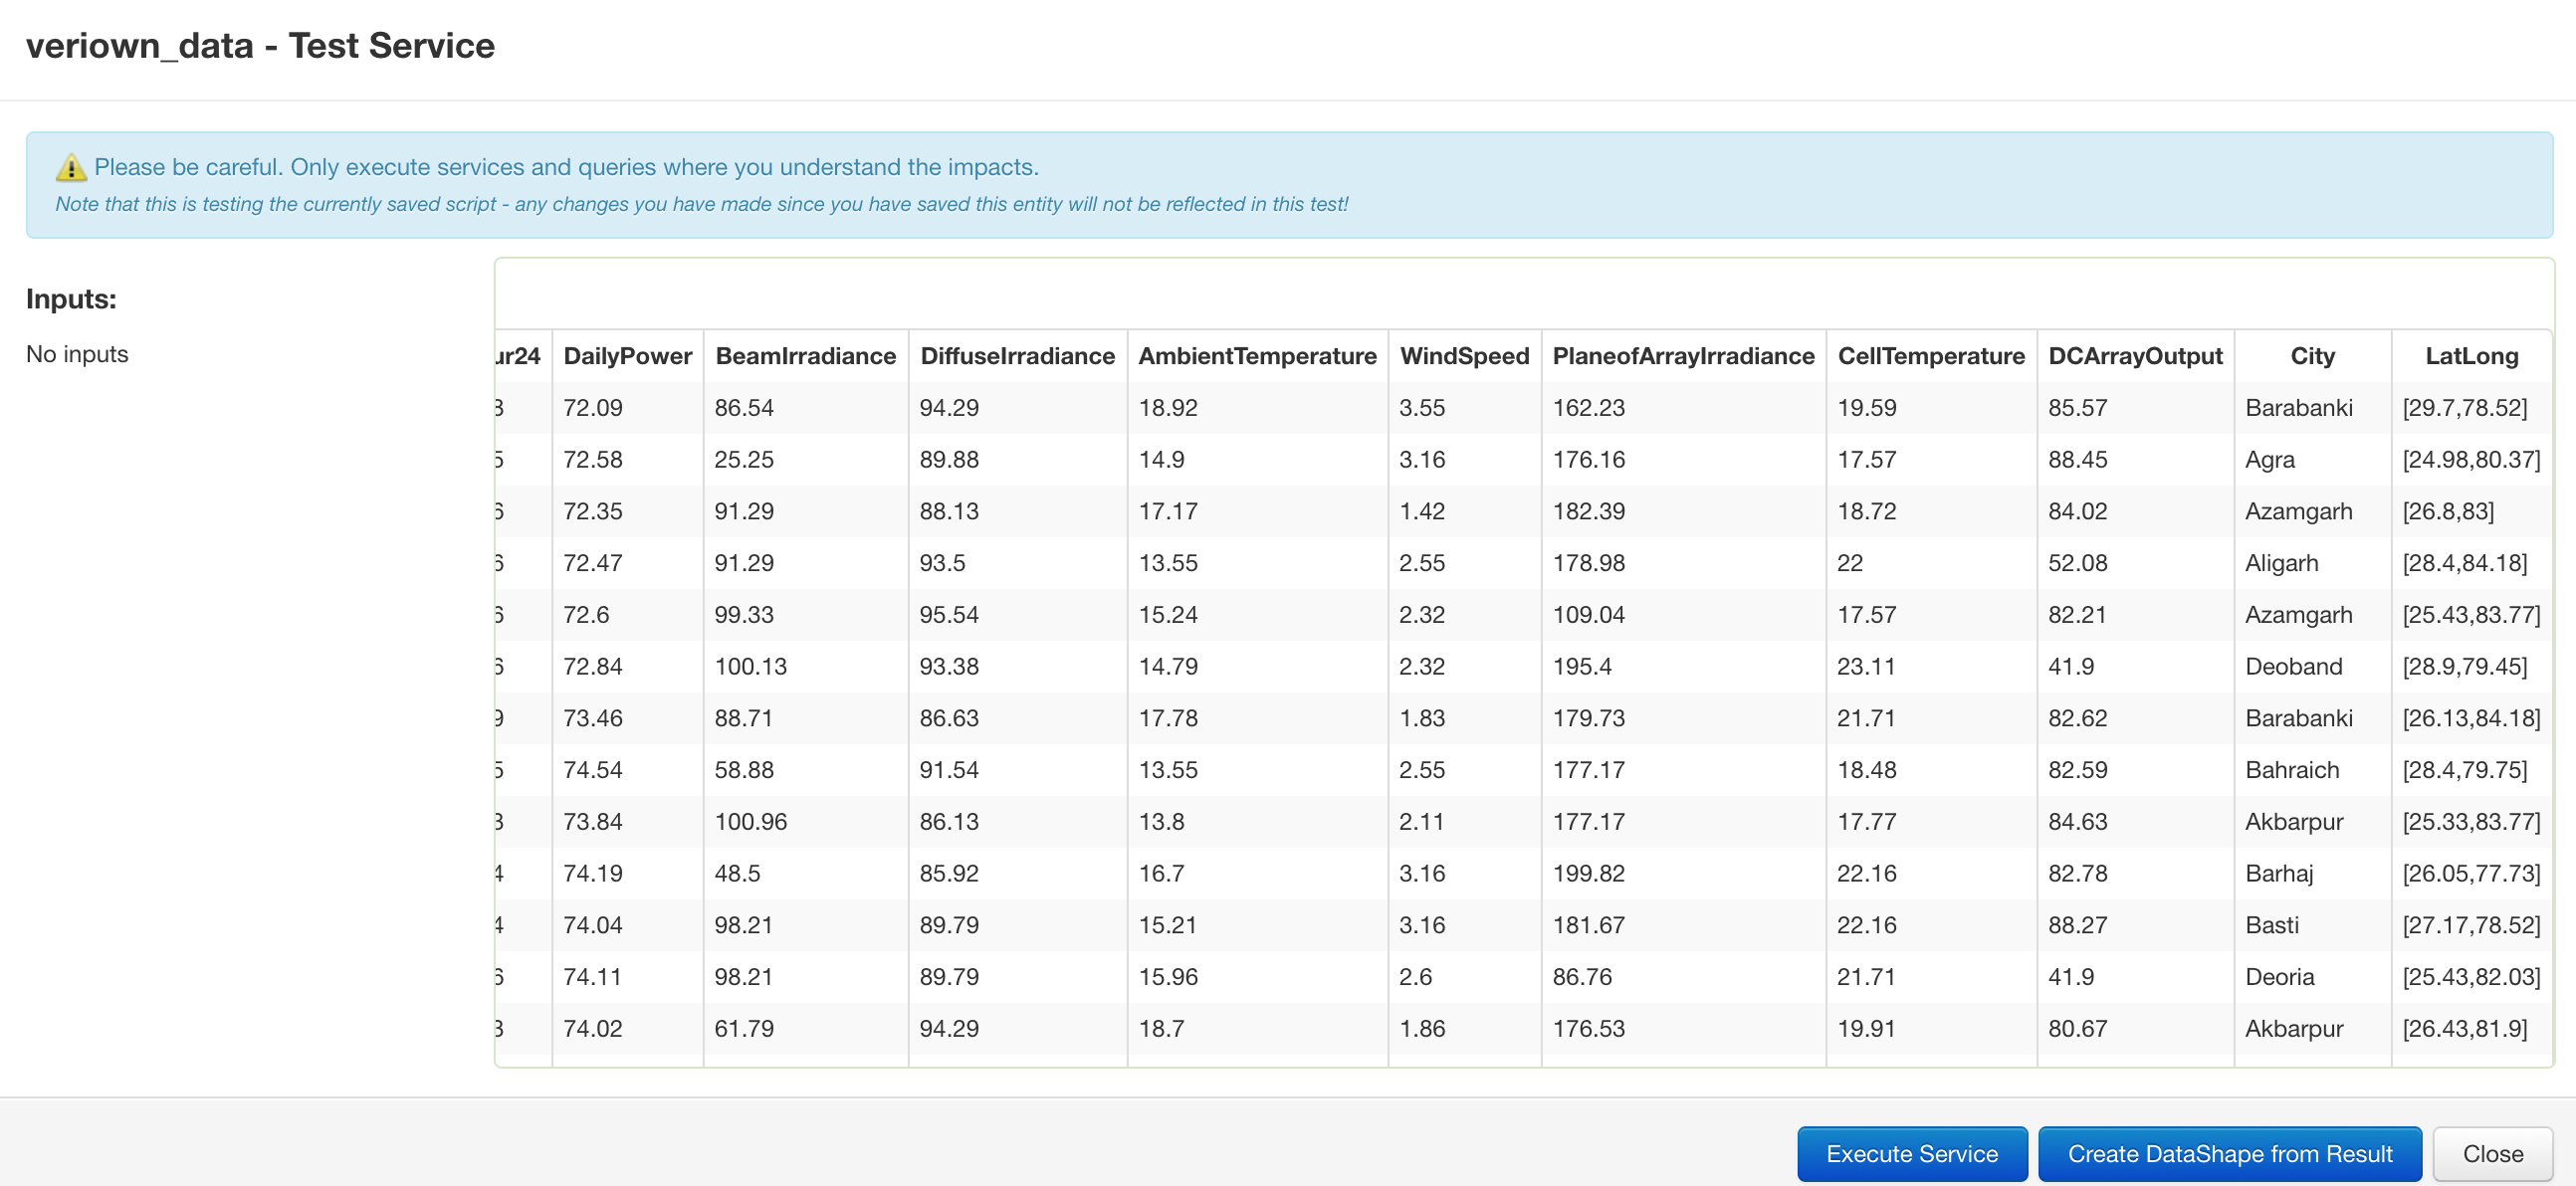
- Then I Execute the program in service to check if the data transferred over as needed. As shown in the screenshot attached.
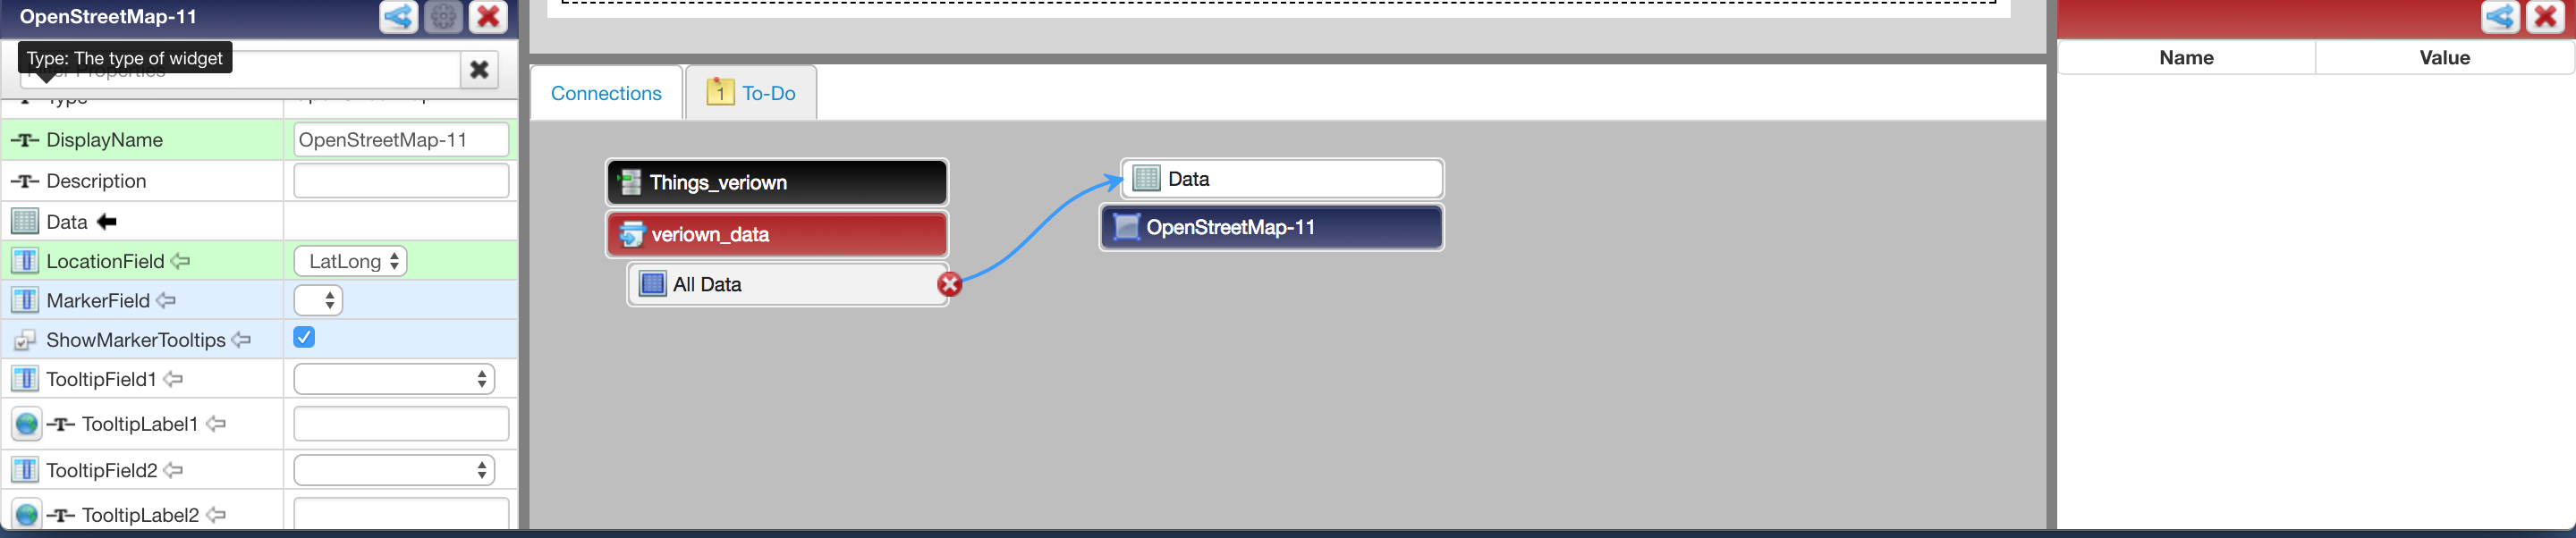
- I save the information and the data shape. Create a visual mashup click and drag the open maps template over and transfer all data into the graph.
- In the Locations field I put LatLong and leave everything else alone and click view mashup.
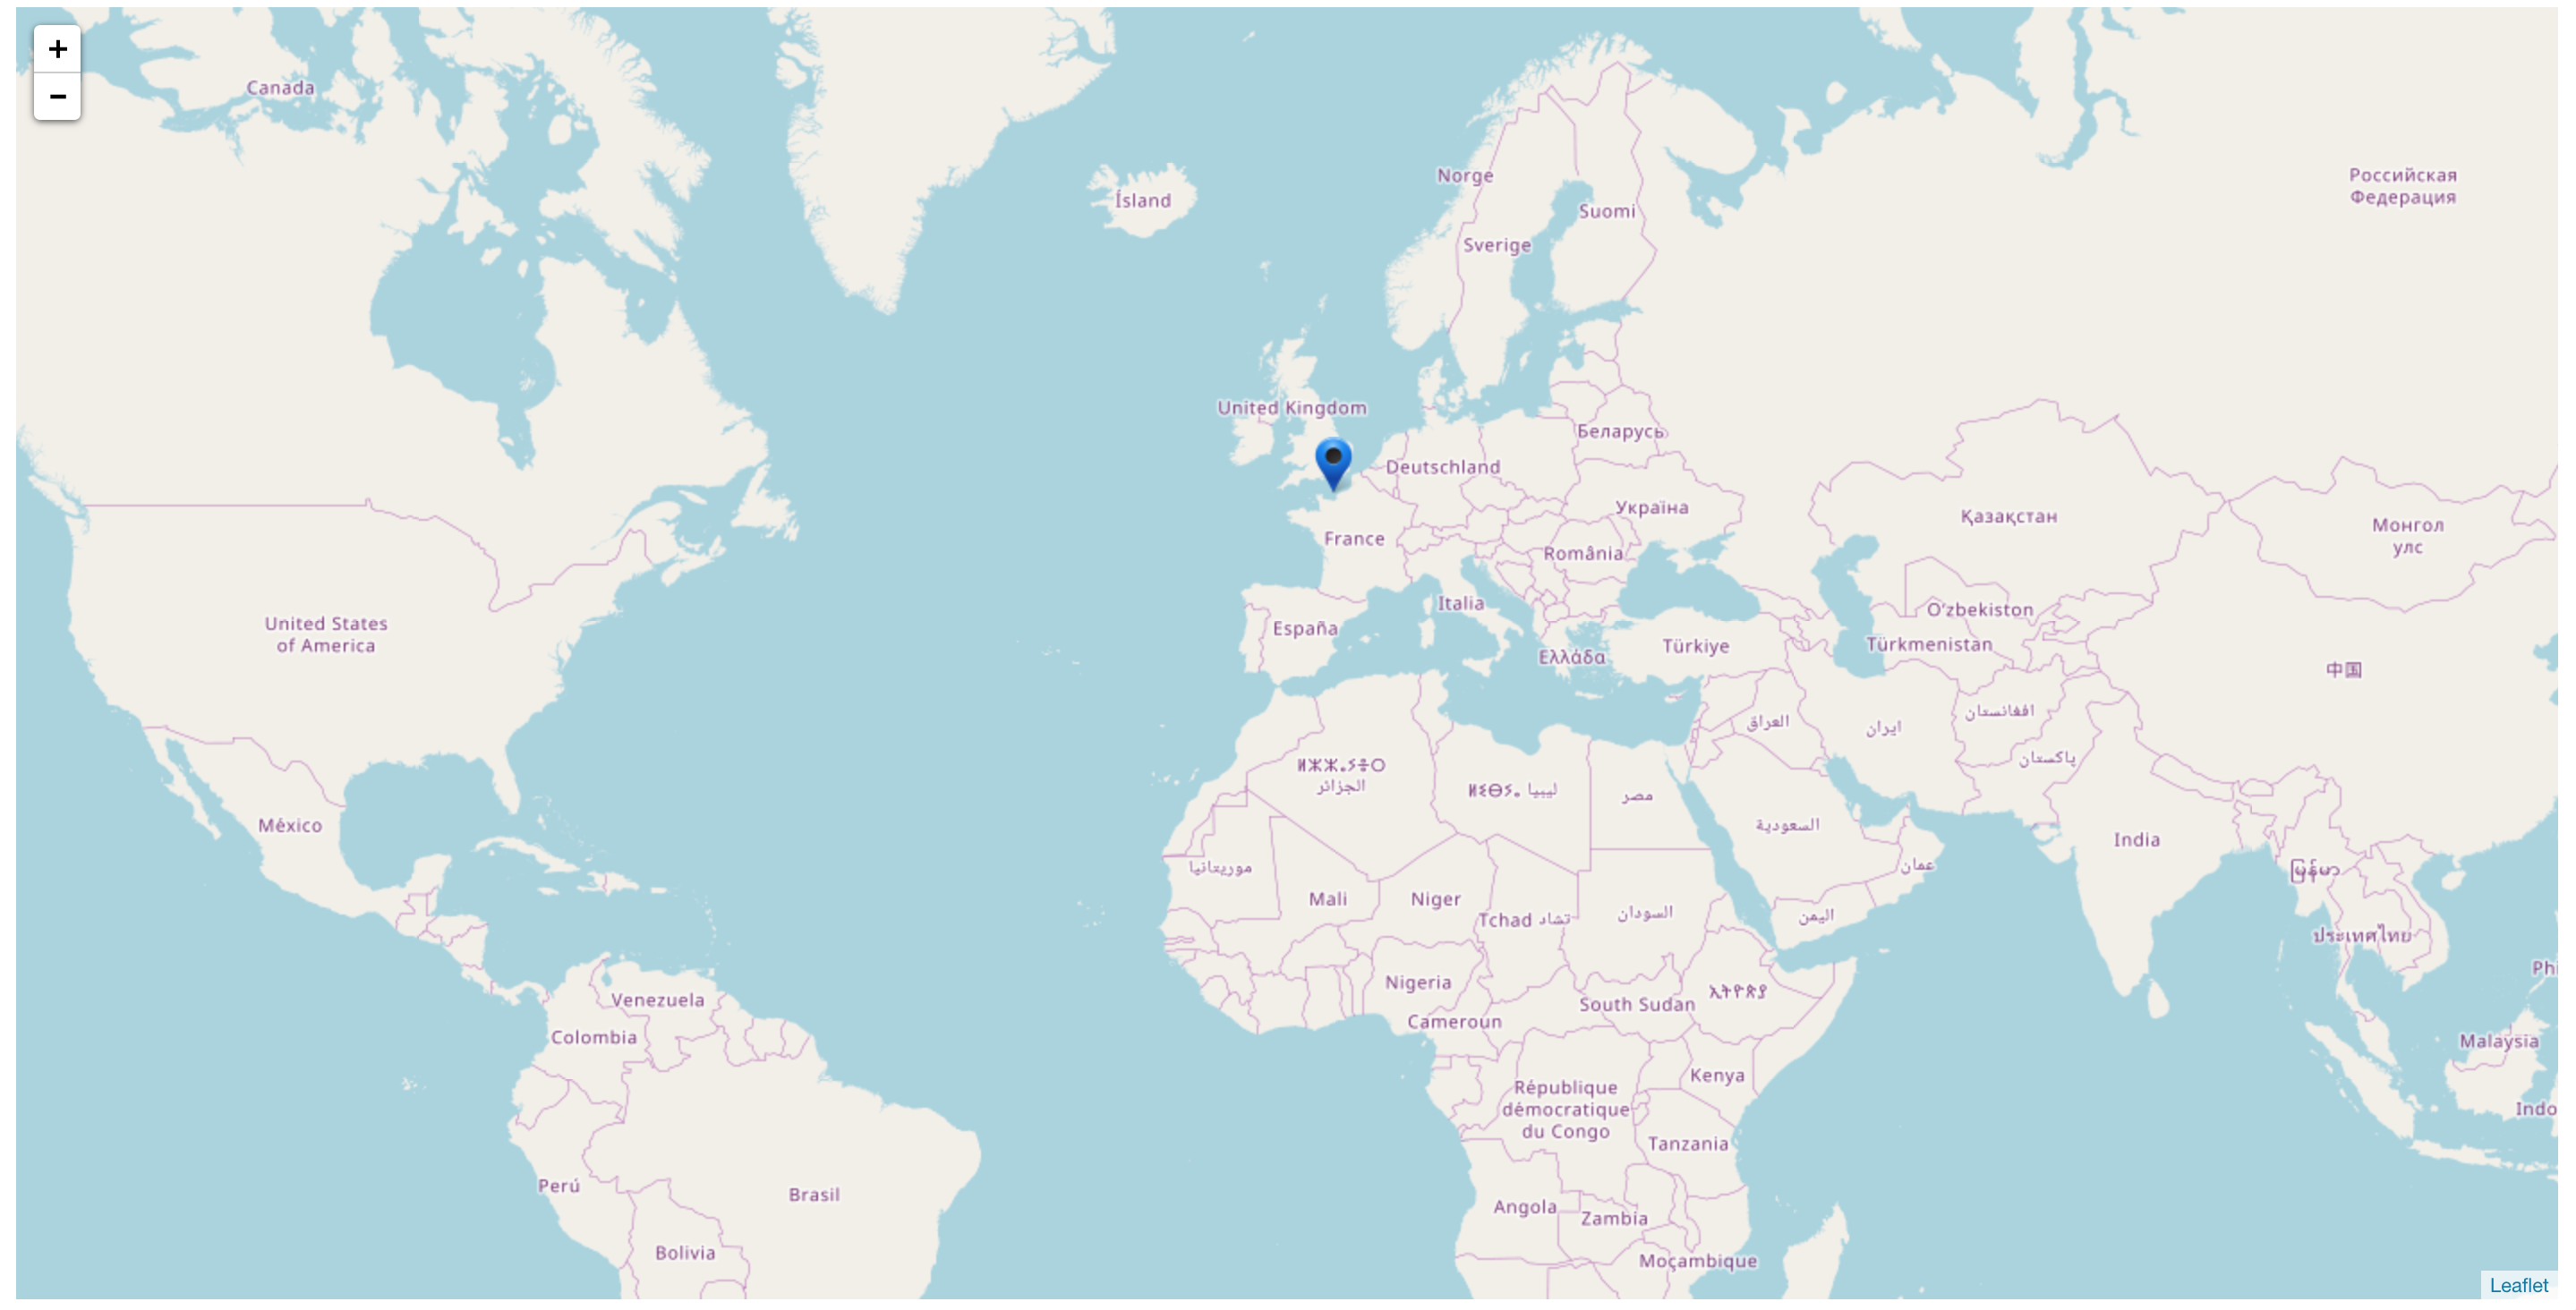
- Doing so creates a blank map with only one dot that is on london.
Please let me know if you need more information.