

Solved
Designing Label Chart
Hi
I am working on a label chart to produce a bar graph. In this i have plotted 10 values which comprises of 5 pairs. I want to cluster these values accordingy.
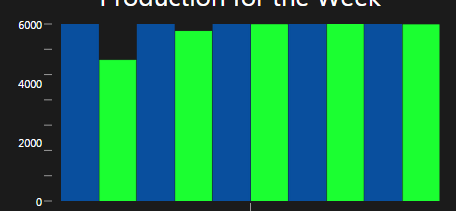
As you can see above but in this i am not able to produce a gap between pairs. How can we do that.
Like in this i want a small gap after every 2 bar.
Thanks