1-Visitor
July 29, 2016
Solved

Show/hide (select/diselect) dataFields in Bargraph

  • July 29, 2016
  • 7 replies
  • 3668 views

Hi there,

I have rather simple request, I would like to show/hide dataFileds on Bargraph based on button or list or radiobutton (does not really matter).

This is a basic functionality at almost every JS Graph library. I cannot replicate this behavior though.

There is no bindable DataFieldxVisible boolean which I could use.

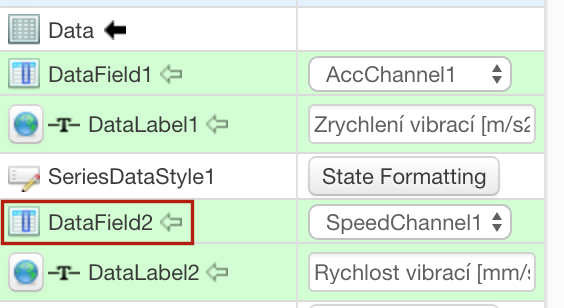
I could assign the Name to the dataFieldx directly, but I dont know what is its data type.
Any suggestions??

Thanks
Best answer by CarlesColl

Hi Tomas,

I've done it, but at the end I had to customize the Standard Timeseries / Barchart graph in order to make it really dynamic. I don't know if with TW 7.2 they had improved graph characteristics, as on the release notes ( from Yesterday ) : "Added the following chart widget extension package. This extension includes the following three charts with enhance functionality: Line Chart, Bar Chart, Time series Chart " --> I've tried to find this new extension on the market place but still isn't there

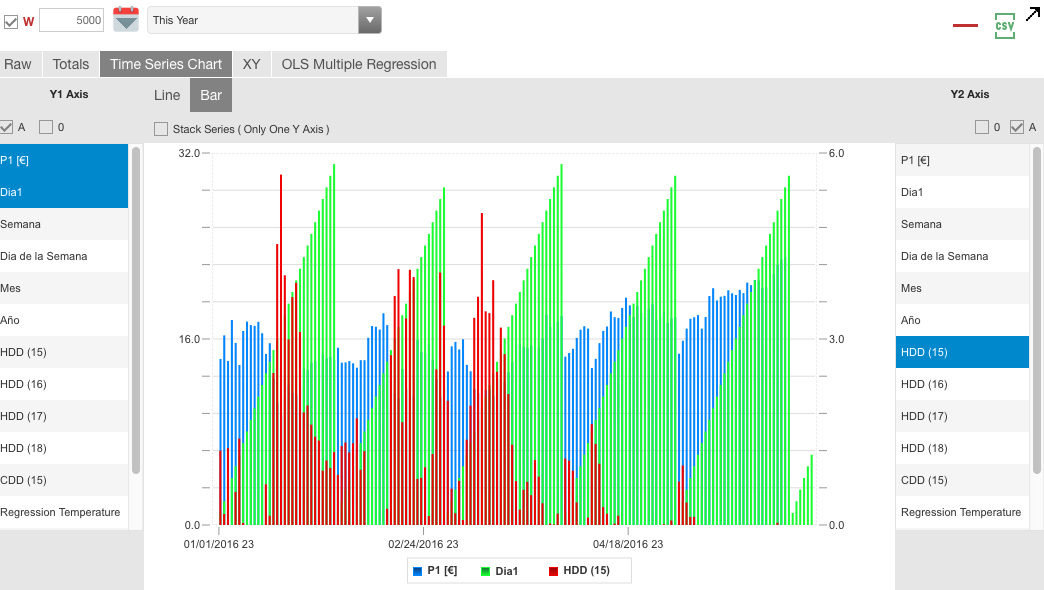
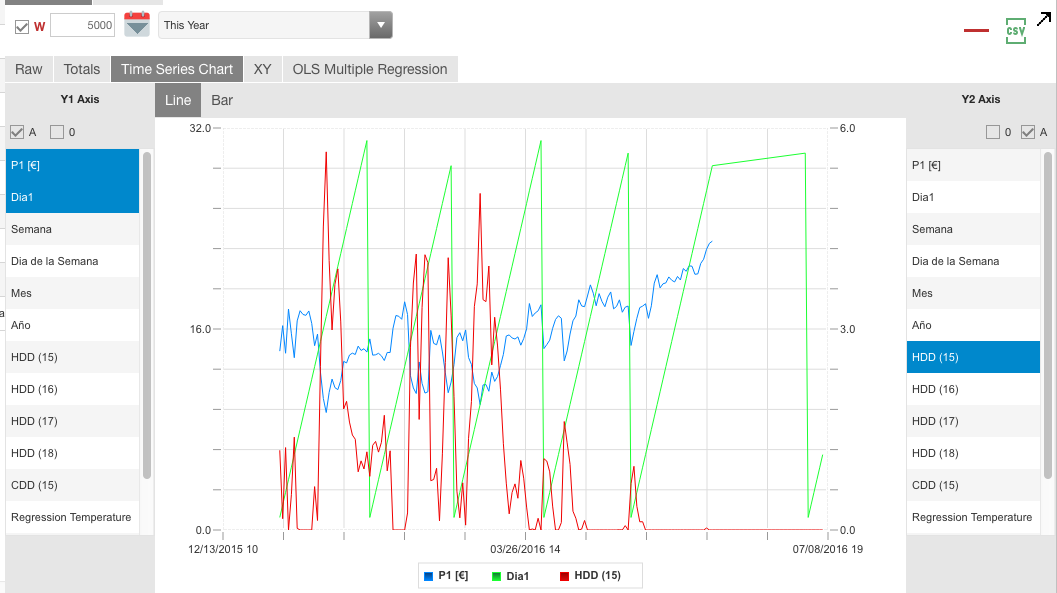
As I understand you want something like the following screenshots ( from our platform ), some features we had to customize:

  • Select different series for Y axis 1, and for Y axis 2 on runtime
  • AutoEscale / Manual Scale / 0 Scale
  • Normal Bars and Stacked Bars

Captura de pantalla 2016-07-29 12.25.23.png

Captura de pantalla 2016-07-29 12.25.32.png

7 replies

1-Visitor
July 29, 2016

Hi Tomas,

I've done it, but at the end I had to customize the Standard Timeseries / Barchart graph in order to make it really dynamic. I don't know if with TW 7.2 they had improved graph characteristics, as on the release notes ( from Yesterday ) : "Added the following chart widget extension package. This extension includes the following three charts with enhance functionality: Line Chart, Bar Chart, Time series Chart " --> I've tried to find this new extension on the market place but still isn't there

As I understand you want something like the following screenshots ( from our platform ), some features we had to customize:

  • Select different series for Y axis 1, and for Y axis 2 on runtime
  • AutoEscale / Manual Scale / 0 Scale
  • Normal Bars and Stacked Bars

Captura de pantalla 2016-07-29 12.25.23.png

Captura de pantalla 2016-07-29 12.25.32.png

tcoufal1-VisitorAuthor
1-Visitor
July 29, 2016

That is exactly what I was talking about.

Any chance to get my hands on that customized Widget of yours????

Thanks for that info about TW 7.2 I had no idea that that is already out.

Tomas

1-Visitor
July 29, 2016

Hi Tomas,

Our custom TimeSeries, Label Chart, comes into a package of other customized standard widgets ( DataTime Picker, Property Display, Grid, TimeSelector ) which we originally customized to support multiple and bindable TimeZones.

I've pushed hard to TW R&D team to add this features on the Standard TW, giving them our code for free. I've presented them the solution more than once during the last Year. But they don't seem to be much interested Still I don't understand how do they plan to support multi TimeZone projects, as it's any worldwide Industrial IoT solution...

We don't plan to share it for now to other TW Customers, but we are really open and we will put our own resources to help TW on adding this to the standard. If you can push them for it, would be helpful.

Best Regards,

Carles.