Solved
Timeseries chart
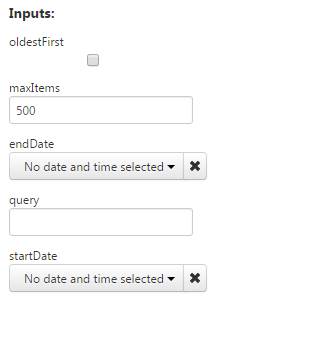
I have an example Thing with a valuestream attached to it.
In Composer, I have a timeseries chart displaying data from "QueryPropertyHistory" of the Thing.... but this only spans for the last ~500 values. How can I get all the data that was logged in the timeseries chart. Do I attach the valuestream to the chart?