

Question
Timeseries chart problem using value stream.
Dear Team,
I need to show time series chart using value stream. I have total 8 assets(things). In which some asset has same value and other one has random value.
As I have seen those asset has same value no value is logged.
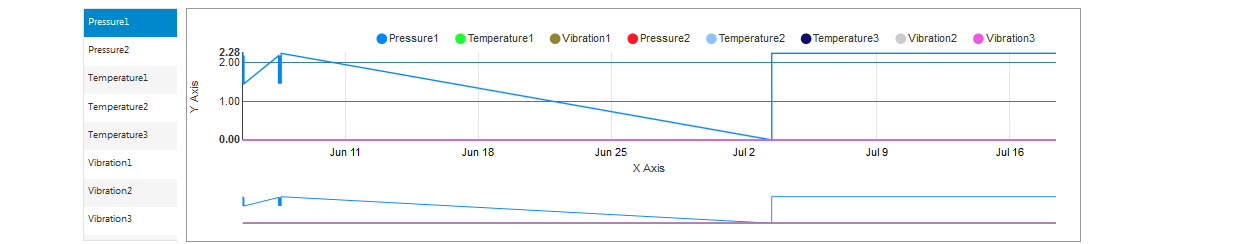
As my asset2 has same value so graph will like.
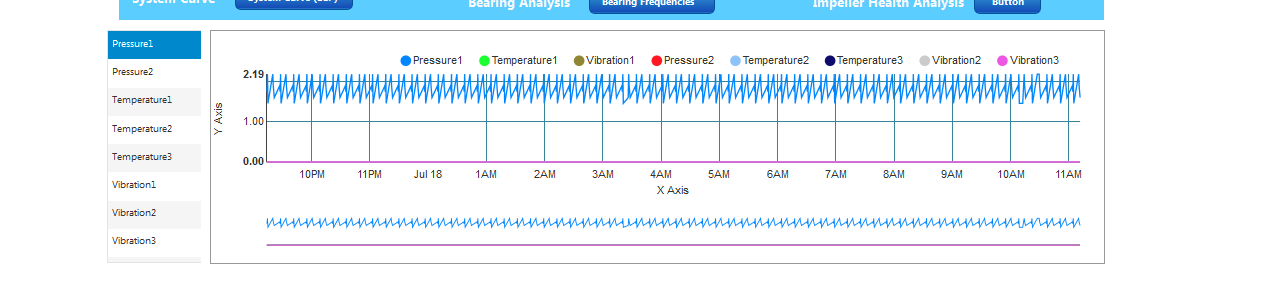
For asset1 has random value so graph will like
SO what is problem in case of asset2. Is logged property value is not get stored due to same value?