How to Configure Automatic Thread Dumps to Occur When there is a Problem
When there is 'weird' stuff going on with performance or stability of a Windchill system one of the things that is often most helpful to diagnose the problem are thread dumps. Thread dumps show what every thread in a MethodServer are doing at that instant, one ore of these can be used to then construct a hypothesis of what the underlying problem is (database query, looping in the code, no work getting to the server etc.) this is particularly important for operations that appear to be hung (usually they aren't really hung but executing or blocked by something else).
There are a couple of ways for an administrator to initiate thread dumps. Generally generating cluster wide thread dumps is easiest and it's not necessary to determine the MethodServer process identifier to target for generating a thread dump for either which can be tricky. Cluster wide thread dumps can be initiated using the jsp page or by using windchill wt.util.jmx.GetClusterStacks from a Windchill shell in R9.1 M50 systems and later. There are also the 'old fashioned' ways of getting thread dumps by using 'cntrl break' in the command window on a Windows machine or 'kill -3 <pid>' on a Unix machine, but these last two aren't used very often anymore. The last way to generate a thread dump is to have JMX initiate the thread dump when certain thresholds are exceeded, this also prevents the administrator from needing to take an action when a problem, the thread dump happens automatically.
The following example procedure details how to configure the method server to automatically generate full stack traces when the execution time of a queue entry in the UserWorkQueue (which processes expression code) exceeds five minutes (300 seconds). This same procedure can be used to generate thread dumps for numerous other notification thresholds which are available under come.ptc --> Monitors.
------------
1) Open JConsole and connect to the ServerManager. For example run the following command in a Windchill shell:
windchill wt.util.jmx.SMJconsole
2) Navigate to com.ptc-->MethodServers-->MethodServer:PID-->com.ptc-->NotificationHandlers-->QueueNotifier-->Operations
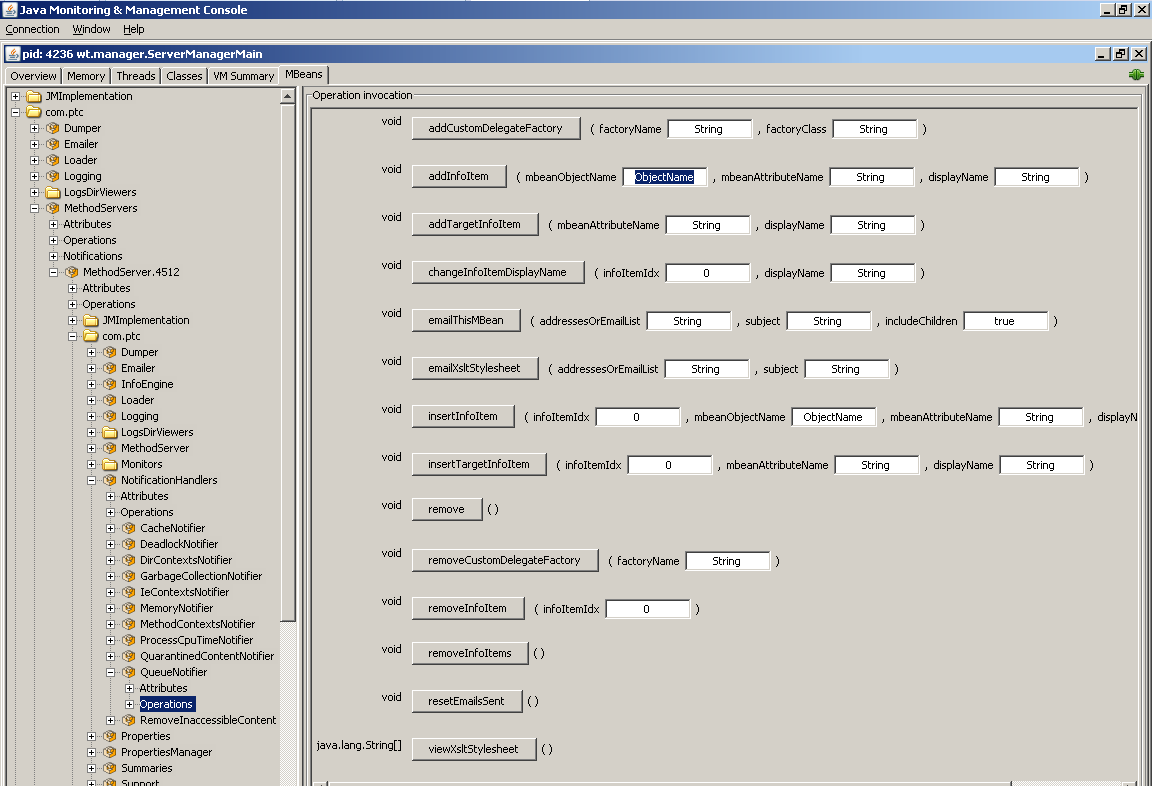
3) Enter the following arguments to the addInfoItem method.
mBeanObjectName=com.ptc:wt.subsystem=Dumper
mBeanAttributeName=FullStackTrace
displayName=displayName=FullStackTrace
Click the addInfoItem button to add this method. You should see a "Method successfully executed" pop up.
4) Switch to Attributes node for the QueueNotifier, set the attribute MultiLineFormat to true.
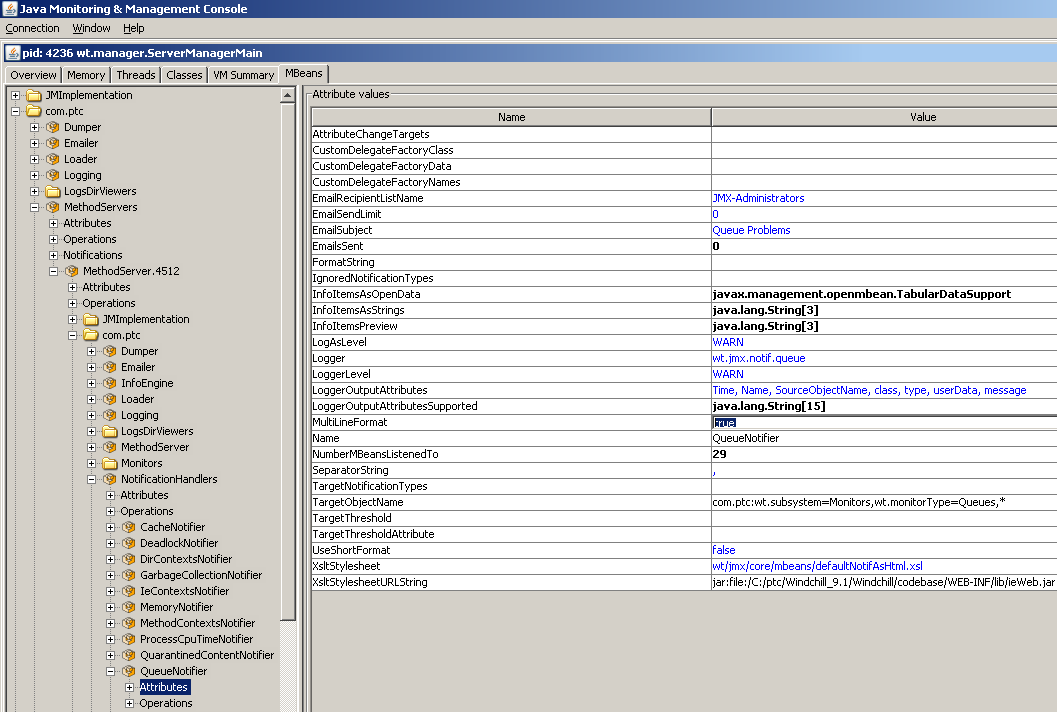
5) Navigate to com.ptc-->MethodServers-->MethodServer:PID-->com.ptc-->Monitors-->Queue-->WfUserWorkQueue-->Attributes
6) Change EntryExecutionTimeThresholdSec from 900 to 300
7) Change MinMinutesBetweenNotifications from 30 to 1
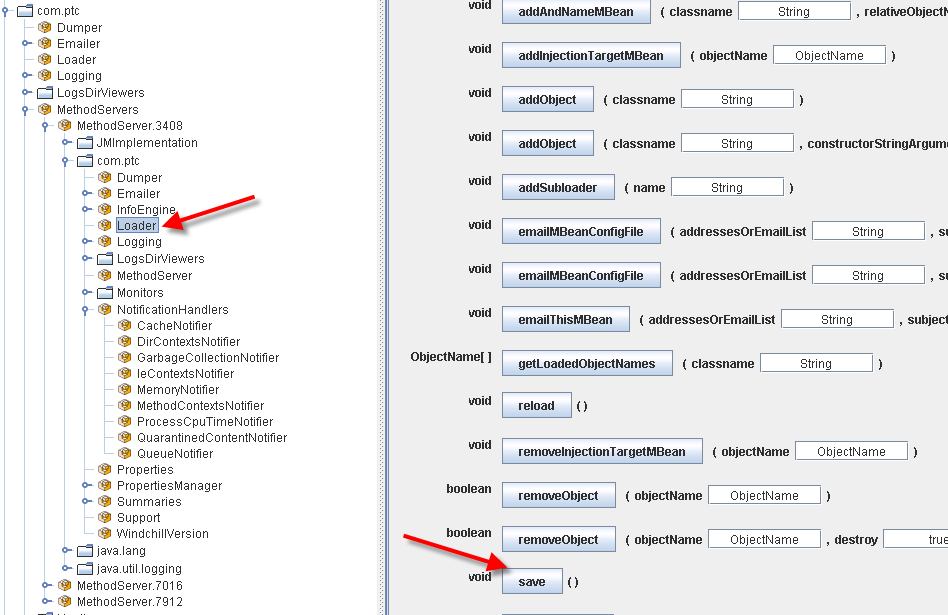
😎 Navigate to com.ptc-->MethodServers-->MethodServer:PID-->com.ptc-->Loader-->Operations
Click the save method to save the changes made to the QueueNotifier and WfUserWorkQueue. You should see a "Method successfully executed" pop up.